The Network#
The VLAN automation had been running for three weeks in the lab. Three switches, one of each vendor, every workflow passing. The team felt confident. On the first production run, 23 of the 800 campus switches failed. All from the same platform, Vendor C. All running a firmware version that nobody had documented.
The playbook was checking the error response from each device after pushing the VLAN configuration. On Vendor C’s current firmware, an already-existing VLAN returns the error code duplicate-vlan. On this older firmware version, the same condition returned vlan-exists. The playbook had been written to treat duplicate-vlan as an idempotency signal, meaning “this already exists, that is fine.” It had not been written to handle vlan-exists, so it treated that response as a failure. A third of the Vendor C switches reported failure. The rollback ran cleanly. The application team’s ticket stayed open for another three hours while the network team manually audited which switches had actually been configured and which had not.
The automation was not wrong. The network had an opinion that nobody had documented.
Six months later, the same team had a containerlab topology mirroring Building B: 24 switches, matching vendor images, with the Vendor C nodes locked to the production firmware version recorded in the Source of Truth (SoT). On the first test run of the VLAN workflow against that topology, 8 Vendor C nodes failed with exactly that error code. The team added vlan-exists to the list of idempotent responses in the Vendor C adapter. Re-run: all 24 nodes passed. Production went out in waves across 800 switches with no adapter failures. Four switches were unreachable, powered down for a floor refit, and were picked up the following week.
The difference was not better code. It was a testing environment that represented reality.
This chapter addresses the block that was always implicit throughout Part 2: the network itself. Every building block built so far was designed by the automation team and behaves according to its documented interfaces. The network was inherited. It has quirks, diverse interfaces, firmware inconsistencies, and capabilities that vary by vendor, platform, and software generation. It addresses two questions: what do we need from the network to make automation reliable, and how do we safely validate automation logic before it touches production?
Fundamentals#
Chapter 3 introduced The Network as one of the seven blocks in the NAF Framework: the only block the automation team does not “own” (it’s in the scope of network engineering). They configure it, observe it, and model its intent, but they did not build the operating system, the data model, or the API interface. That dependency shapes every design decision in the platform above it.
Chapter 6 covered the Executor’s write path and Chapter 7 the Collector’s read path. Both treat one thing as given: that the device on the other end exposes a reliable, consistent interface. This chapter asks whether that assumption holds, and what to do when it does not. The two paths usually meet on the same device and often on the same protocol.
This chapter closes Part 2. The six previous chapters built the automation platform: a place to store intent, a way to execute it, a way to observe results, an engine to coordinate everything, and surfaces to expose it to consumers. This chapter addresses the thing the platform was always pointing at.
Three goals define The Network block’s contribution to the automation platform:
Support the full network infrastructure spectrum. Any large-scale automation platform may talk to campus switches, data center fabrics, cloud VPCs, Kubernetes overlays, overlay controllers, and legacy gear simultaneously. Each type exposes different programmable interfaces. The platform must handle all of them without collapsing into a single lowest common-denominator abstraction.
Validate the automation logic for a new network architecture design before touching production. Simulation environments serve two purposes: they are the pre-production gate where logic errors, interface contract violations, and device-specific quirks are caught at the cost of minutes in a lab rather than hours in a production incident, and they are the design environment where new network architectures are explored and validated before any hardware is ordered.
Keep the automation platform stable as the network evolves. New vendors are added. Firmware versions change. New infrastructure types arrive. The platform must be designed to absorb this change through abstraction strategies, not through ad-hoc patches to every workflow whenever the network changes.
What’s in scope
- The interfaces through which the Executor and Collector reach network devices. Both NETCONF and gNMI support configuration and telemetry operations; the choice between them per use case depends on operational strengths, not protocol exclusivity. The protocol is often shared between blocks; the operation type differs.
- The testing environments and methodologies that validate automation before production
- Abstraction strategies for managing multi-vendor and multi-platform heterogeneity
- The implications of cloud, Kubernetes, and overlay networking for automation design
What’s out of scope
- Configuration generation and template rendering (the component layer, Chapter 4)
- Execution mechanics: how automation tooling executes a task (Executor, Chapter 6)
- The telemetry collection pipeline: how metrics flow into the time-series database (Observability, Chapter 7)
The boundary is consistent: this chapter covers the network’s side of each interface, not the platform’s side. And, that boundary is what the three functionalities below are organized around.
Functionalities#
The Network block is the only building block in the NAF framework that the automation platform does not control. It can only interface with the network as the network allows. Every design decision in the previous six chapters, how intent is stored, how execution runs, how telemetry is collected, how workflows are coordinated, how consumers are served, ultimately resolves to a question about what the network device on the other end of the connection supports. This chapter examines that constraint directly.
The constraint reaches every block. A device that only speaks CLI forces the Executor’s adapter into screen scraping. A device missing an OpenConfig path leaves the Collector with a vendor-specific workaround or a gap. The topology caps what the Orchestrator can run in parallel: a batch size that is safe for a flat access layer can partition a leaf-spine fabric if it hits several spines at once. Every other block’s contract is one the automation team wrote and can change. The network’s is discovered, varies by firmware release, and sometimes contradicts its own documentation. A contract you cannot set, you at least write down: the SoT records OS version, interface capability, and topology role next to the inventory, because they gate adapter selection, collection method, and concurrency. A SoT without them is incomplete in ways that only show at execution time.
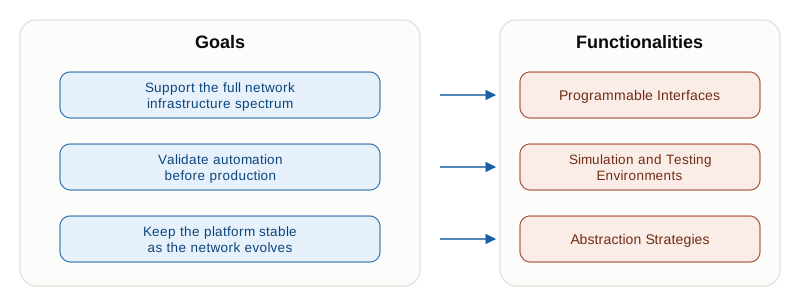
- Programmable Interfaces: the full range of network types the platform must automate, and the interface each one exposes to the Executor and Collector.
- Simulation and Testing Environments: the toolchain for pre-production validation. Where different lab environment types fit, how they connect to the Saga Pattern from Chapter 8, and how to scale them.
- Abstraction Strategies: structural approaches that allow the automation platform to remain stable as the underlying network changes, regardless of vendor, platform generation, or interface protocol.
The first one decides everything downstream, because a device that exposes nothing programmable cannot be automated whatever the rest of the platform looks like.
Programmable Interfaces#
The network is heterogeneous by nature. It is not one thing. It is a spectrum of infrastructure types accumulated over years, often built in parallel by different teams (ownership and organizational boundaries are explored in Chapter 14), each with its own interface model, abstraction level, and automation maturity. A modern automation platform can span campus switches, data center fabrics, cloud VPCs, overlay controllers, Kubernetes clusters, service provider WAN infrastructure, and hyperscaler-managed forwarding planes, simultaneously. The platform must handle all of them. The infrastructure type determines what interface is available; the automation platform adapts to that reality rather than mandating a uniform interface.
This is a high-level recap of different network infrastructure scenarios you may have to tackle, depending on the nature of your company:
Campus and branch switching is the core scenario I used as the example throughout Part 2: multi-vendor physical switches, three platforms in one fleet. Modern campus gear exposes Command Line Interface (CLI), NETCONF, and gNMI simultaneously. Automation maturity is high for equipment from the past five to seven years; it is patchy for legacy gear still running decade-old firmware.
Data center fabric topology is typically leaf-spine, often from a smaller vendor set: Arista, Cisco Nexus, Nvidia Cumulus or automation-native open networking platforms. Interface uniformity is higher than campus; change management is stricter. EVPN/VXLAN overlays add a management plane above the fabric that may have its own API, separate from the individual device interface. More recently, SRv6 source routing has arrived in high-performance AI fabrics. This is also where open networking platforms land first. SONiC, DENT, and OPX run Network Operating System (NOS) software on commodity hardware, and SONiC-based platforms (Cisco 8000 and a growing ODM ecosystem) are now common in hyperscaler-influenced and large-scale enterprise data centers.
Service provider and WAN infrastructure (carrier-grade routers, MPLS networks, Segment Routing SRv6 fabrics) has its own automation challenges: scale, protocol complexity, and the dual concern of control-plane configuration and traffic engineering policy. NETCONF and YANG models are well-established in this space; vendors like Cisco IOS-XR and Junos have mature YANG coverage. The automation platform often targets a controller (SR-PCE, Crosswork, NSO) rather than individual devices.
Cloud networking: AWS VPC, Azure VNet, GCP VPC and others. REST APIs with eventual consistency semantics. There is no concept of “pushing a config” and waiting for a synchronous confirmation. The Executor handles async operations: create, poll, verify. Infrastructure-as-code tooling fits this model naturally. The automation platform must account for the different consistency model, not assume synchronous apply-and-confirm semantics.
SD-WAN and overlay networks (Cisco SD-WAN, Versa, VMware VeloCloud) are controller-managed. The automation target is the controller API, not the individual device. The physical underlay still exists but is managed entirely through the overlay’s abstraction. This affects both execution and observability: the Executor writes policy to the controller; telemetry about traffic, path selection, and policy enforcement also flows through the controller’s northbound interface, not directly from the physical underlay devices.
Kubernetes networking at the CNI layer inverts the device model entirely. The network is defined through Kubernetes API objects: NetworkPolicy, Services, Ingress, and custom resources from CNI plugins such as Cilium, Calico, or Flannel. The device disappears as an automation target. The Kubernetes API is the interface. Network policies are code, not device configuration. This is the model others are converging toward: declarative intent, controller-reconciled state, no direct device access.
DPUs and SmartNICs (Nvidia BlueField, Intel IPU, Marvell Octeon) represent a shift in where network processing happens. In modern data centers, DPUs are installed alongside CPUs on every server to offload network functions: VXLAN encapsulation, encryption, firewall policy enforcement, load balancing, and microsegmentation. This offloads these functions from the host CPU and from network appliances to the SmartNIC firmware. The consequence for automation: “the network device” is no longer only a switch or router in the rack. Functions previously managed through dedicated network appliance APIs are now managed through the DPU management plane and its vendor SDK, a new interface category that standard NETCONF and gNMI tooling does not yet reach cleanly.
Wireless network (Cisco DNA, Aruba Central, Juniper Mist) are controller-based; the automation target is the controller API. Relevant whenever VLAN provisioning extends to wireless SSIDs alongside wired switch ports, as it would in the campus scenario.
Out-of-band and management networks carry every other interface in this list. Console servers, terminal servers, management switches, and jump hosts are the path the Executor’s writes and the Collector’s reads actually travel, which makes this the one infrastructure type whose failure takes the platform with it. Two consequences follow:
- It is a target like any other. Management VRFs, the ACLs deciding which hosts may reach a device’s management plane, and console server access all belong in the SoT and under automated configuration, even though many teams still maintain them by hand.
- It earns a stricter change policy than the data plane. A change that breaks in-band reachability can be recovered over out-of-band, while a change that breaks out-of-band reachability needs someone to drive to the site. Where the platform supports it, a confirmed commit is the device-side mitigation, which is why that capability is on the checklist in the Per-device interface selection section below.
The point is not to enumerate every infrastructure type exhaustively. It is to establish that a platform automating any non-trivial network interacts with multiple types simultaneously. The Executor and Collector must route each operation to the correct interface type. The SoT must model intent at a level above the individual interface. The complexity of the network is the design constraint the automation platform has to absorb.
Programmable Interface types#
Each infrastructure type exposes one or more interface types to the automation platform. The same physical switch may expose many simultaneously. The platform adapts to what is available, with preferences that reflect reliability, structure, and scale. No interface type is a universal mandate; the right choice depends on what the device supports and what the operation requires.
- CLI over Secure Shell (SSH) is universal, legacy, and fragile. Screen-scraping and text parsing breaks when firmware changes output formatting or adds new fields. Error codes are inconsistent across vendors and across firmware versions. CLI is still the only option for older gear. The recommendation is to minimize its use and avoid building workflows that depend on it for anything more than the devices that have no alternative (the last resort). Setting an interface description looks like:
interface GigabitEthernet0/1
description uplink-to-core- NETCONF is structured, transactional, and correct when it works. It supports atomic operations and rollback, and its data model is machine-parseable. The transport layer (XML over SSH) is generally reliable; the data model layer is where the gaps are. Vendor YANG model quality varies significantly: a device may claim NETCONF support but have incomplete or proprietary models for features the platform needs. IETF and OpenConfig YANG models standardize the intent layer; vendor-native YANG models fill the gaps. The same interface description via NETCONF:
<config>
  <interfaces xmlns="urn:ietf:params:xml:ns:yang:ietf-interfaces">
    <interface>
      <name>GigabitEthernet0/1</name>
      <description>uplink-to-core</description>
    </interface>
  </interfaces>
</config>- RESTCONF is the HTTP-based equivalent of NETCONF, using the same YANG models but exposed over REST semantics. It is useful when teams are more comfortable with HTTP tooling than with NETCONF’s XML/SSH transport. The data model is the same; only the transport differs. Vendor support is less uniform than NETCONF. The same interface description via RESTCONF:
PATCH /restconf/data/ietf-interfaces:interfaces/interface=GigabitEthernet0%2F1
Content-Type: application/yang-data+json

{
  "ietf-interfaces:interface": {
    "name": "GigabitEthernet0/1",
    "description": "uplink-to-core"
  }
}- gNMI and gNOI are gRPC Remote Procedure Call (gRPC)-based protocols. gNMI handles telemetry and configuration read/write; gNOI handles operational commands. Modern and scale-friendly. Vendor support is getting broader, though the models are not always compatible across vendors. Chapter 7 covered gNMI from the Collector’s perspective. This chapter covers the device-side prerequisite: the device must support gNMI subscriptions at the OS version the platform targets. The same interface description via gNMI SetRequest:
path:  /interfaces/interface[name=GigabitEthernet0/1]/config/description
value: "uplink-to-core"- Vendor REST APIs (eAPI, NX-API, Cumulus NVUE, and similar) are machine-readable but not standardized across vendors. Useful as a gap-filler when NETCONF or gNMI is absent or incomplete for a specific operation. Nvidia Cumulus switches expose NVUE (a structured REST API with consistent JSON schema) as their primary programmatic interface; Arista and Cisco Nexus expose eAPI and NX-API respectively as alternatives to NETCONF. Treat these as adapter-layer concerns, not as a foundation for a vendor-neutral platform. The same interface description via Arista eAPI (JSON-RPC over HTTPS):
{
  "jsonrpc": "2.0",
  "method": "runCmds",
  "params": {
    "version": 1,
    "cmds": [
      "interface GigabitEthernet0/1",
      "description uplink-to-core"
    ],
    "format": "json"
  },
  "id": "1"
}- Cloud and controller APIs follow REST patterns with eventual consistency. The async operation model is a design requirement, not a limitation to work around. For SD-WAN, wireless, and DPU management planes, the controller API is often the only available interface. Adding a description to an AWS VPC illustrates the pattern: a tagged resource update submitted asynchronously, with no synchronous confirmation that the change was applied:
POST https://ec2.eu-west-1.amazonaws.com/ HTTP/1.1
Content-Type: application/x-www-form-urlencoded
Authorization: AWS4-HMAC-SHA256 ...

Action=CreateTags
&ResourceId.1=vpc-0a1b2c3d4e5f67890
&Tag.1.Key=Description
&Tag.1.Value=uplink-to-core
&Version=2016-11-15- The Kubernetes API is declarative, controller-reconciled, and consistent across vendors. NetworkPolicy, Services, and CNI custom resources are the automation targets. There is no direct device access; the API server is the sole interface. A network isolation policy for the
app-paymentsservice:
apiVersion: networking.k8s.io/v1
kind: NetworkPolicy
metadata:
  name: app-payments-isolation
  namespace: production
spec:
  podSelector:
    matchLabels:
      app: app-payments
  policyTypes:
  - Ingress
  ingress:
  - from:
    - namespaceSelector:
        matchLabels:
name: app-payments- SONiC CONFIG_DB (Redis) is the native interface for SONiC-based platforms. Rather than a protocol layered on top of the OS, it is the OS’s own configuration store: a Redis database with a YANG-structured schema. Automation writes JSON entries directly to CONFIG_DB; SONiC’s internal
orchagentdaemon reconciles the intent to the hardware forwarding tables. gNMI is available in parallel for telemetry reads. This is architecturally distinct from CLI, NETCONF, or REST: the interface is the data store itself. The SONiC and open networking section covers this in more depth. The same interface description written to CONFIG_DB via JSON patch (applied withconfig load):
{
  "PORT": {
    "Ethernet0": {
      "description": "uplink-to-core",
      "admin_status": "up"
    }
  }
}Per-device interface selection#
When a device exposes multiple interfaces, the platform must choose one per operation type and maintain that choice consistently. A campus switch exposing CLI, NETCONF, and gNMI simultaneously requires a decision, not a mix-and-match approach that varies by workflow or engineer preference. Running two management protocols against the same box should be a last resort because of the added complexity.
Recommended hierarchy, applied per operation type. Both gNMI and NETCONF support configuration writes and telemetry reads; the preference below reflects operational strengths, not protocol exclusivity:
- gNMI or NETCONF preferred for both configuration and telemetry: structured and scale-friendly. NETCONF adds transactions and rollback, but it is less widely adopted than gNMI.
- RESTCONF or vendor REST API as fallback when NETCONF is incomplete for a specific feature
- CLI as last resort: for gear with no structured interface, and for the operational actions no data model exposes
That last line deserves qualifying. Even a current platform with complete NETCONF coverage still needs CLI or gNOI for actions that live outside the configuration model: clearing counters, installing an image, saving the running configuration, collecting a support bundle. gNOI is the structured answer where a device implements it, and the platform should prefer it over screen-scraping the same command. What it should not do is pretend the category does not exist and leave every team to bolt on a CLI path under pressure.
Two device capabilities deserve a place on the evaluation checklist alongside the protocol itself, because they decide what the network automation platform can safely do and they vary by platform and release:
- Confirmed commit. The device applies the change and reverts it automatically if the platform does not confirm within a timer. This is the device-side protection against a push that cuts the platform’s own path to the device, and it is the difference between a bad change costing a pipeline run and costing a site visit. Support is uneven, so it belongs in the SoT as a per-platform attribute, and a fleet that mixes supporting and non-supporting platforms needs the fallback Chapter 12 prescribes: a pre-change snapshot and an external rollback path. Chapter 16 shows it inside a closed loop.
- Configuration replace. Whether the device can accept a full declared configuration and remove what is no longer in it, rather than only merging additions. Merge-only interfaces can add a VLAN but cannot converge a device back to intent, because nothing deletes the lines intent no longer contains. Chapter 6 sets out the gradient this sits on, merge then replace then overwrite, ordered by blast radius, and the advice to pick the narrowest one that achieves the change. What belongs here is the prior question: which of the three the device supports at all, because a platform that only merges cannot be reconciled, and that decides whether drift remediation is possible on it.
From the perspective of the two architecture blocks that interact with the programmable interfaces:
The Executor needs Idempotency or at least reliable error codes distinguishing “already exists” from “failed,” structured error responses, and state verification capability after apply. The
vlan-existsversusduplicate-vlanproblem from the opening story was precisely a failure of the second condition: the error code semantics changed between firmware versions.The Collector needs structured reads, streaming telemetry subscriptions, and consistent data models so the Observability layer does not need per-device parsers. gNMI is the preferred subscription protocol where supported: it is structured, hierarchical, and schema-validated at the device, which eliminates the per-device text parsing that dominated SNMP-era collection.
However, the error code that opened this chapter was documented nowhere; the team found it by running the workflow against a device. That is the question the next functionality answers: where do you run the workflow first, when the only thing that behaves like a network device is a network device?
Simulation and Testing Environments#
The network is production infrastructure. Unlike an application backend, there is no staging server to test against by default. Building one is the job of this functionality. Without one, this quote applies:
Everyone has a test environment. Some are lucky enough to also have a separate production one.
Michael Stahnke
Testing network automation has always been harder than testing application code. A network is a distributed system with many components the automation team does not control: neighboring ASes at peering points, upstream transit providers, customer-managed CPE, wireless clients, and cloud infrastructure operated by third parties. A service provider testing a routing policy change cannot spin up a mock BGP peer from a transit provider to validate the full behavior. An enterprise testing a WAN failover workflow cannot control how the MPLS provider responds.
The simulation environments described in this section are the best available substitute: they reproduce what the team controls, accept the limitations of what they cannot, and focus validation on the logic layer where bugs actually live.
Simulation serves a second audience, and it is the one that was using labs long before automation arrived. A lab is where a new design gets validated before any hardware is ordered: does this EVPN control plane converge the way the design document claims, does the route-reflector topology survive losing a reflector, does the leaf-spine ECMP distribute the way the capacity model assumed. That work needs full-NOS behavior rather than fast startup, which is why it lives in the VM-based environments and physical labs below rather than in the commit-level pipeline. The two uses share a toolchain and almost nothing else: design validation asks whether the network is right, and the pre-production gate asks whether the automation is right. This chapter spends most of its time on the second because it is the one that is new, but a team that already runs a design lab has most of what the gate needs.
The testing pyramid from Chapter 2 (unit, integration, end-to-end) applies directly here. Unit tests validate individual automation modules in isolation, typically with mock device responses. Integration tests validate multi-step interactions: the SoT API returns the expected data structure, the component layer translates it correctly, the Executor handles the device response correctly. End-to-end tests validate the full workflow against something that behaves like a real network device. Simulation environments are the end-to-end layer.
Environment types#
The right environment depends on what the test needs to validate. There is a spectrum, from high-fidelity environments worth investing in for production-confidence testing, down to low-cost environments that suit routine CI/CD pipelines. Table 10.1 runs it in that order, from the real hardware to the lightest emulation.
| Environment type | Startup | Control plane | Forwarding | CI/CD fit |
|---|---|---|---|---|
| Physical hardware lab | N/A (always on) | Yes | Hardware | Manual |
| VM-based emulation | Minutes | Yes | Software | Limited |
| Container-based emulation | Seconds | Yes | Software | Native |
Physical hardware labs are a rack of actual switches and routers, often mirroring the production architecture patterns. Use them for hardware-specific behavior, performance testing, and the scenarios emulation cannot reproduce at all: optics, transceivers, ASIC-level forwarding behavior, and anything where the silicon is the thing under test. The cost is significant: capital investment, power and space, and the operational overhead of keeping the lab topology synchronized with production architecture. Labs that drift from production patterns provide false confidence. The value is real; the maintenance discipline is the challenge.
VM-based emulation runs full NOS images as virtual machines. Use it for protocol interoperability, design validation, and full-NOS behavior testing, where the question is how the network behaves rather than whether the automation is correct. Forwarding is software, as it is in a container below, so a VM lab buys NOS completeness rather than hardware realism: the full feature set, the real control plane, the vendor’s own code paths. The tradeoff is cost: more memory and CPU per node, minutes rather than seconds to start, and limited integration with automated pipelines. Not practical for routine commit-level testing.
Container-based emulation uses lightweight network OS images running as containers, connected by virtual links. Topology startup takes seconds. Use it for automation logic, interface contract validation, and workflow testing, which is most of what a pipeline needs to check. It is the practical default for routine CI/CD: the team runs the same workflow code against a containerized topology on every change, catching logic errors before production. Packets do forward: veth pairs carry traffic, BGP sessions establish, and a trunk passes frames. What a container cannot reproduce is the hardware: ASIC forwarding behavior, line-rate throughput, QoS queueing, and anything involving optics. For validating automation logic, software forwarding is enough.
Digital twins are live replicas of the production topology, fed by the Source of Truth (same device models, topology, and current intended configuration) and current state from Observability. A digital twin mirrors what production actually looks like right now, not an approximation. The operational cost is significant: maintaining synchronization between the digital twin and production requires continuous reconciliation. It is a maturity-level investment, appropriate for teams that have already validated their platform at scale and need the highest level of pre-production confidence.
Container-based emulation is the practical starting point for most teams. It starts in seconds, integrates natively with CI/CD pipelines, and covers the modern campus and data center equipment used in the majority of automation use cases. The investment in building this environment pays back in the first incident it prevents.
Building that environment by hand, starting each image and wiring each virtual link, stops being practical past a handful of nodes. Lab orchestration tools do that part, and the Solutions Landscape section later in this chapter compares them. What matters first is where the lab sits in the deployment sequence.
Simulation as the pre-production gate#
Chapter 8 introduced the Saga Pattern: every step in a workflow carries a compensating action that runs if a later step fails. That is what makes a failed production change recoverable. Simulation adds the step before the Saga begins. Run the workflow against a simulated topology first, and a logic error costs a pipeline run instead of a rollback across 800 switches. Only a passing simulation run proceeds to the production target.
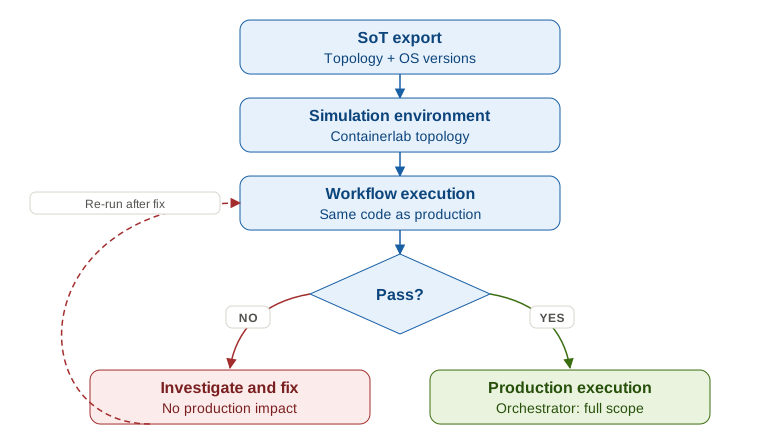
Four steps make it work:
- The SoT exports the topology definition for the target scope, including the OS version of every device in it.
- The simulation environment is instantiated with matching vendor images, OS versions pinned to the SoT intended state.
- The same workflow that will run in production runs against the simulation target first.
- Any step that fails in simulation triggers investigation before production execution proceeds.
Step 2 is the one teams skip. A topology built from whatever images were already on the build host tests the firmware the vendor ships today, not the firmware in the rack, and that gap is where the opening story came from.
This gate only works where there is something to instantiate, which means the physical domain. You cannot start a wireless controller, an SD-WAN orchestrator, or a cloud VPC in a lab topology, and those domains are half of what the Programmable Interfaces section catalogued. They are not exempt from the gate; they need a different one. For a controller, the equivalent is a sandbox tenant or a non-production controller instance, which most vendors offer and which is the only honest test of a controller API. For cloud, it is a separate account or project plus the provider’s own dry-run: terraform plan against the real API returns the exact set of resources a change would create, modify, and destroy, which catches the same class of error a lab run catches. Both cost less than a container lab and both are skipped more often, because neither looks like a lab.
A passing simulation run is not permission to deploy to the full scope. It is the first gate in a sequence that continues in production, one wave at a time, and the gates between waves are workflow steps that Chapter 8 covers in its Validating health at each wave gate section.
Known limitations#
The map is not the territory.
Alfred Korzybski
Simulation reduces risk. It does not remove it, and three limits are worth naming before a team starts reading a passing lab run as proof.
The firmware fidelity gap. A container image usually ships recent NOS code, and the quirks that break automation usually live in old code. Unless the image is pinned to the firmware version the SoT records for those devices, the lab reproduces the firmware you wish you had rather than the one in the rack. Pinning is what turned the opening story around: the Vendor C nodes in that containerlab topology ran the production version, which is why vlan-exists surfaced in the lab instead of in Building B. What simulation reliably catches is logic errors, interface contract violations, YANG model gaps, and topology-level failures. What it cannot catch is a device state nobody thought to reproduce.
The live-endpoint gap. A lab may not have users on it. You cannot simulate four thousand connected endpoints, their DHCP renewals, their 802.1X supplicants, the MAC table churn of a working floor, or the badge reader and label printer that stop when a VLAN moves underneath them. This is the limitation that matters most for the chapter’s own example, because a campus VLAN change rarely fails on the switch; it fails on what was plugged into it. State the boundary precisely: simulation validates the configuration path, not the service impact on live endpoints. The wave gate’s service-state check (Chapter 8) is where that gap gets closed, and it closes it in production, on one wave at a time, which is the reason waves exist.
The snowflake problem. Simulation is only as representative as the network is consistent. A fleet of hundreds of individually customized configurations, each with its own history and exceptions, cannot be represented by any topology small enough to run in a pipeline. This is the practical argument for standardized design patterns, golden templates, and SoT-driven configuration: a well-designed network is a simulatable network, and the value of the lab compounds with the discipline of the design. It also makes simulation a joint output rather than an automation deliverable. The engineer who knows which sites are genuinely identical and which carry undocumented exceptions is a network engineer, and without that knowledge the topology is a guess.
A lab proves the platform works against the network you have today. It says nothing about the vendor that gets added next quarter, or the firmware release that changes an error code again. That is the last functionality’s problem.
Abstraction Strategies#
The network is heterogeneous by nature, and not just in the sense that vendors differ. Any automation platform operating at scale spans physical switching, cloud infrastructure, overlay controllers, service provider WAN infrastructure, and legacy gear simultaneously. Each speaks a different language. The automation platform must not be rebuilt each time a new infrastructure type is added.
This section is about designing the automation layer to absorb change rather than break under it: not just handling today’s heterogeneity but designing for the infrastructure types that will be added next year.
Three strategies follow, and they are not alternatives to choose between. They stack, in this order:
- Start with the Adapter Pattern, because it works on the fleet you have today and needs nothing from your vendors.
- Adopt a common data model where you have tested that the vendor implements the paths you need. It shrinks the per-platform translation, without removing it or the adapters.
- Converge the operating system only where you still choose the platform, which in most organizations means new data center builds and nothing else.
Modern automation platforms span multiple infrastructure domains simultaneously. The architecture that handles this cleanly applies whether the operator is a large enterprise, a service provider managing WAN and customer edge simultaneously, or a hyperscaler running data center fabric alongside cloud networking overlays. The key point: the Executor writes and the Collector reads through the same device interface (gNMI/NETCONF for physical gear, REST for cloud and controllers), so the interface protocol is a shared concern for both blocks, not a separate design choice per block.
That is why the network interface sits between the platform and everything behind it in every domain below. It is the single boundary both the write path and the read path cross, which is also why one firmware change can take out configuration and telemetry at the same time.
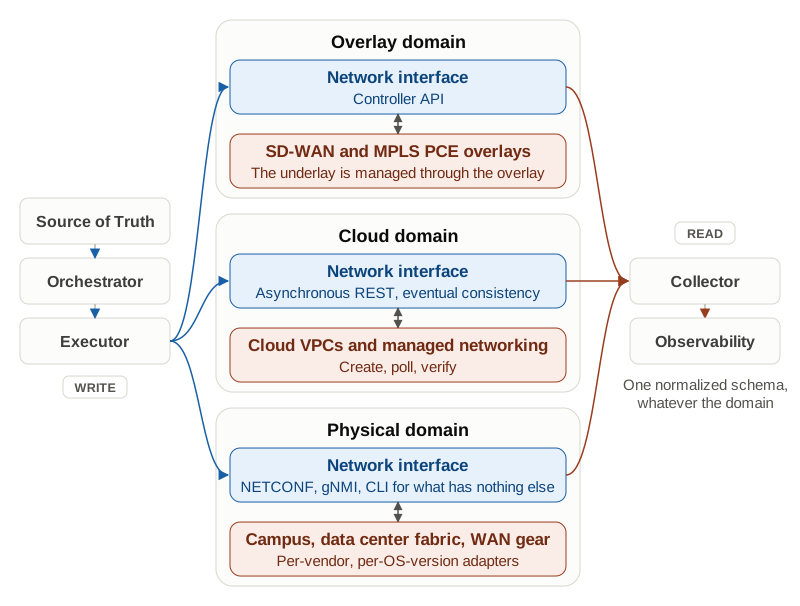
The Source of Truth models intent across every domain as one service model in the technical layer. The component layer then translates that model into what each inventory item expects: CLI lines for one switch, a YANG payload for another, an API request body for a cloud VPC. The Orchestrator may branch the workflow by network domain. The Executor picks the adapter for each target from SoT data and delivers the change through it.
That split is the backbone of this section, so it is worth stating plainly. Abstraction happens in two places, and each has one owner:
- Data model abstraction belongs to the Intent block. Turning vendor-agnostic intent into vendor-specific syntax is the component layer’s job (Chapter 4). A new vendor means a new template or module, not a new model.
- Interface abstraction belongs to the Executor. Speaking the protocol, managing the session, following the device’s operation model, and reading its error codes is the Network Adapter’s job (Chapter 6). A new protocol means a new adapter, not a new model.
Ownership is not location. Chapter 4 describes two places the component layer’s code can run: Render in the Source of Truth, where templates next to the data hand the Executor a finished artifact, and Translate in the Executor, where a declarative module receives technical-layer data and produces the syntax itself, usually because it needs the device’s current state to compute the delta. In the second case one Executor module hosts both halves, and that is fine, provided the data it receives stays vendor-agnostic and its diff is visible before it applies. Most fleets end up with both, chosen per platform.
The Collector mirrors the Executor on the read path. One collection adapter per protocol reads the device, and the Observability Processor normalizes the result into one schema (Chapter 7). Many collector tools embed the Processor, which is the same responsibility hosted in the same tool, not a change of owner. The opening story’s bug sat on the interface side of the split: the VLAN syntax was right, and the adapter misread what the device said back.
Dimensions of heterogeneity#
Before choosing an abstraction strategy, it helps to understand the axis of heterogeneity that strategy must absorb. Not all heterogeneity is the same kind of problem.
| Dimension | What varies | Platform design response |
|---|---|---|
| Multi-vendor physical | CLI syntax, YANG models, and error codes | Component layer: one template or module per platform. Executor: one adapter per device interface |
| Firmware generations (same vendor) | Syntax or behavior changes between OS versions | Component layer picks the template or module by OS version. Executor branches its adapter on the running version |
| Physical vs. cloud | Synchronous apply vs. async REST with eventual consistency | A cloud provider module translates the intent into API calls. Executor runs create, poll, verify |
| Physical vs. overlay | A controller abstracts the underlay and becomes the target | Component layer produces controller policy. Executor and Collector talk to the controller, not the devices |
| Edge vs. core | Recoverability: an access switch can be reloaded, a spine cannot be taken out of service | Orchestrator sizes waves by blast radius: two spines outweigh four hundred access ports, and core rollback must fit the maintenance window |
Read the last column by the kind of work. A difference in what the device expects to receive is translation work, and it belongs to the component layer, whether that runs as a template in the SoT or as a module in the Executor. A difference in how the device is reached, or in how it answers, is interface work, and it belongs to the adapter: the Executor’s on the write path, the Collector’s on the read path. The technical layer stays unified, and the Orchestrator only sees heterogeneity where it changes the shape of a rollout. The strategies that follow are different ways of keeping those two layers small.
The Adapter Pattern across the SoT, Executor, and Collector#
The Adapter Pattern is the most common starting point and the most widely implemented strategy: one translation module per platform, all accepting the same input. Following the split above, the pattern shows up twice on the write path, and Figure 10.4 draws both variants side by side.
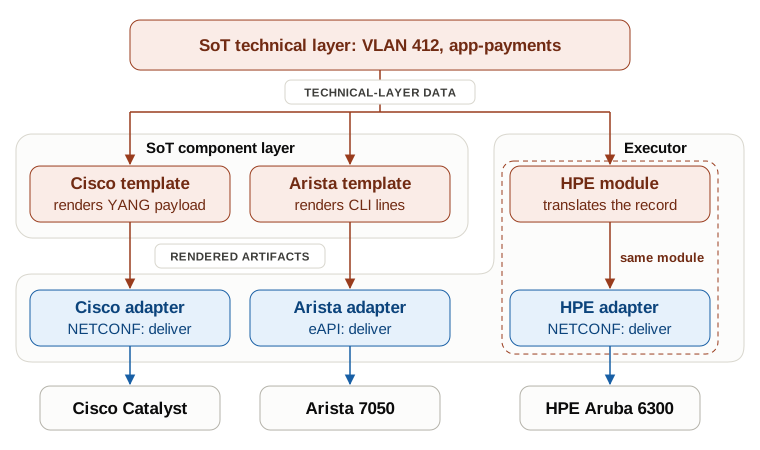
In the component layer, one template or module per platform translates the same technical-layer record into each vendor’s syntax. In the Executor, one adapter per device interface delivers the result and interprets the response. In the figure, Cisco and Arista render in the Source of Truth, so their Executor adapters only deliver. HPE translates in the Executor, so one module does both jobs: it translates the technical-layer record, which is component-layer work, and delivers the result, which is adapter work. The row of translation boxes is the same in both; only the region hosting it changes.
The Collector applies the same principle on the read path: one collection module per vendor or protocol. A vendor that speaks gNMI uses one adapter; a vendor that requires SNMP polling or proprietary REST uses another. The Processor then normalizes what they deliver, so the rest of the Observability layer sees the same data schema regardless of the upstream collection method.
Practical to build and well-understood. The maintenance burden grows as the device inventory diversifies: each new vendor or OS version requires new or updated translation, a new adapter, or both. The Adapter Pattern scales well for a defined set of vendors; it becomes burdensome when the platform must support a large and frequently changing device catalog.
Be precise about which objection that answers. Robotron settles the scale question and leaves the diversity question open, because a hyperscaler’s device catalog is narrower and far more tightly controlled than an enterprise’s. Facebook chose its platforms; a company with campus gear from four vendors, a WAN from a fifth, an inherited data center from an acquisition, and three firmware generations in each did not. The pattern’s weakness is the breadth of the catalog, not the number of devices in it, and the paper does not test that. What it does give you is the part the pattern description leaves out: how a template set is maintained as the device catalog changes underneath it, which is exactly the work that makes per-platform translation expensive.
Community and industry-driven YANG models#
The Adapter Pattern absorbs heterogeneity by writing code per vendor. A common data model attacks it one level up. If every vendor exposed the same schema for the same feature, most of that per-vendor code would not need to exist: the platform writes intent once against a standard model and expects it to work on any compliant device.
Network engineering has run this experiment before, and the result is worth remembering before betting a platform on it. SNMP MIBs were the first attempt at a common network data model. MIB-II, IF-MIB, and BGP4-MIB gave every vendor a shared vocabulary for basic monitoring, and private enterprise MIBs covered everything else. Both halves of that outcome held: the standard MIBs genuinely worked for the common case, and nothing beyond the common case was reachable without vendor-specific work. YANG inherits the same split. What it improves is the model, which is hierarchical and richly typed rather than a flat table of OIDs, and the transport, which is transactional over NETCONF or gNMI rather than polled. What it does not change is the economics. Standards cover the common case; vendor extensions remain unavoidable for the full feature set.
Three families of YANG models coexist in production networks, and the distinction decides which one the platform targets:
- IETF models are developed through the IETF standards process and published as RFCs or Internet-Drafts. They are the foundational standards:
ietf-interfaces,ietf-routing,ietf-bgp. Adoption is broad but slow, and the process is thorough but takes years. Vendor implementations often arrive two to four years after publication, and only on newer platforms. - OpenConfig models are developed by the OpenConfig consortium, an operator-driven group including Google, AT&T, and Deutsche Telekom. OpenConfig iterates faster than the IETF and is more operationally focused. It covers many of the same functional areas with different schema design choices. Most production gNMI deployments use OpenConfig paths.
- Vendor-native models are each vendor’s own extensions:
cisco-ios-xe-native,junos-conf-root,arista-eos-augments. These expose features the standard models do not cover, and they are often required for anything beyond the common-denominator functions. Nokia SR OS is a useful case to check your assumptions against: its native models (nokia-conf,nokia-state) are the complete interface, standard-model coverage is partial, and teams automating it in depth generally end up on the native models. Treat that as the pattern rather than the exception. For any platform, the question is not whether it supports OpenConfig but which of the paths you actually need it supports, and the only way to find out is to query the device.
The three families are the YANG equivalent of the MIB split, with one extra layer in the middle. IETF models are the standard MIBs, vendor-native models are the private enterprise MIBs, and OpenConfig is the layer SNMP never had: a standard written by the operators who have to run it rather than by a standards process alone. A heterogeneous network navigates all three at once.
A YANG module defining an interface looks like this (simplified from ietf-interfaces):
module ietf-interfaces {
  container interfaces {
    list interface {
      key "name";
      leaf name      { type string; }
      leaf description { type string; }
      leaf enabled   { type boolean; default true; }
    }
  }
}The same structure appears in OpenConfig (openconfig-interfaces) and in vendor-native models, but with different paths, different leaf names, and different default semantics. The YANG module defines the schema; the component layer maps between the standard and the vendor reality; the protocol (NETCONF or gNMI) and the Executor’s adapter carry the result to the device.
The practical reality of OpenConfig: vendor implementations vary in completeness. A device may claim OpenConfig support but only implement a subset of the model: reads work, writes do not; or the interface model works but the BGP model is absent.
Beyond missing paths, the more insidious problem is inconsistent data. A device returns a value for an OpenConfig path but in the wrong unit, with a different type, or with fields that should be null populated with vendor-specific defaults. A gNMI subscription that works in SAMPLE mode may fail silently in ON_CHANGE mode on the same device.
These are not rare edge cases. They are the everyday reality of operating a multi-vendor platform that relies on OpenConfig in production. The standard works on paper; the vendor implementation requires the same per-device investigation the standard was supposed to eliminate. OpenConfig reduces that work significantly, but does not eliminate it. Plan for device-specific testing before relying on a new OpenConfig path in production automation.
YANG translation layers, such as Cisco NSO’s Network Element Driver model, accept vendor-neutral intent and emit vendor-specific commands or YANG edits. The automation team writes to a standard model; the translation layer handles all vendor-specific rendering. Heavy investment, high payoff at scale, and high operational cost when the device catalog is large and diverse. Note where it sits in the split: it is Translate in the Executor at product scale. It takes both halves at once, the translation and the device interface, so adopting it moves the component layer out of your SoT and into the tool.
Abstraction buys uniformity at the cost of feature access. Every vendor has proprietary capabilities with no equivalent in standard models. A team using OpenConfig must choose: ignore the feature, add a vendor extension, or maintain a vendor-specific override path. There is no clean answer. In practice, most automation work concentrates in functions well-covered by standard models (VLANs, BGP, interfaces), and proprietary features matter but are rarely the core use case. Gate feature usage on the OS version recorded in the SoT rather than assuming uniform support.
SONiC and open networking#
The two strategies above absorb heterogeneity after the fact: per-platform translation and adapters absorb each vendor, and common models reduce how much translating is left. Open networking attacks a different part of the problem. If the same network operating system runs on hardware from many vendors, the vendor axis collapses: one configuration interface, one data model, one adapter, whatever silicon is underneath. Converging the OS across platforms is the only strategy in this section that removes a dimension of heterogeneity rather than absorbing it, which is why it belongs here and not in a procurement discussion. The constraint is that you can only apply it where you still get to choose the platform.
SONiC’s configuration interface is a Redis database with a YANG-structured schema: uniform, programmatic, and designed for automation from the start. The vendor-specific adapter work that consumes effort in multi-vendor physical environments does not apply here. The same automation logic works across all SONiC-based platforms regardless of the underlying hardware vendor.
A VLAN entry in the SONiC CONFIG_DB looks like:
{
  "VLAN": {
    "Vlan412": {
      "vlanid": "412"
    }
  },
  "VLAN_MEMBER": {
    "Vlan412|Ethernet0": {
      "tagging_mode": "untagged"
    }
  }
}This JSON is written directly to Redis via sonic-cfggen or the SONiC management REST API. There is no CLI to parse, no XML to construct. The automation platform writes structured data; SONiC’s orchagent reconciles it to the hardware forwarding tables.
This is the design direction open networking advocates for: a network interface designed for automation rather than adapted to it. Teams introducing SONiC-based platforms alongside traditional gear will find the SONiC adapter to be the simplest to write and the most reliable to operate.
SONiC has moved well beyond its Microsoft Azure origins, and the vendor list is much longer. Microsoft Azure SONiC remains the upstream reference, and other vendors, such as Arista, Dell, and Nvidia, run SONiC on some of their platforms. Alongside them, ODM vendors including Edgecore, Celestica, and UfiSpace ship branded SONiC platforms. A SONiC-based platform is now commercially available at every price and performance tier, which is what makes the single-NOS strategy something other than a lock-in with extra steps.
The mature use case is the data center leaf-spine fabric. Hyperscalers have run SONiC at scale for over a decade and enterprise data centers are now following, so EVPN/VXLAN overlay, BGP routing, ECMP load balancing, and 400G/800G interface support are all well-validated. The automation story is the strongest part: gNMI, YANG, and the Redis-backed CONFIG_DB are native interfaces rather than retrofits, so a SONiC fleet can be managed with the same tooling that manages any other gNMI-enabled platform.
Outside the data center fabric, SONiC is still arriving. Disaggregated routing platforms, where SONiC runs on high-port-count routers rather than switches, extend the open NOS model to routing use cases, and upstream SONiC now includes SRv6, which service providers are using in production for traffic engineering and network slicing, and for newer data center use cases. Campus deployments remain rare, and the constraint is hardware rather than software: the ecosystem for campus form factors is thinner.
For teams building new platforms today, the question is no longer whether SONiC is production-ready in the data center, because it is. The open question is whether a given vendor’s SONiC fork and release cadence will stay aligned with upstream across the platform’s lifecycle, because a fork that drifts hands you back the per-vendor adapter you adopted SONiC to avoid.
Managing coexistence during firmware migration#
The Adapter Pattern assumes a known, stable OS version per device. During a rolling firmware upgrade, that assumption breaks: devices in the same role, managed by the same automation platform, run different OS versions simultaneously for days or weeks. The abstraction layer that worked yesterday on firmware 10.12 may not work on firmware 10.13 until a new adapter path is added.
The SoT records intended state for every attribute the platform operates on, and OS version is one of them: the intended version is what the operations team approved, and the running version is what the device reports. That part is not a special case. It is the same intent-versus-reality pattern that applies to intended VLANs, intended BGP neighbors, and intended interface descriptions. What makes OS version different is the consequence of divergence. For most attributes, divergence is drift to reconcile. For OS version, it also selects the adapter path, because the same vendor’s firmware behaves differently between releases. So before the Executor applies configuration, it reads the running OS version and picks the adapter for that version, rather than assuming the intended version is already deployed.
This distinction matters practically. The SoT says a Vendor C switch should run release 10.13. The device reports it is running 10.12.1006. The platform has two options: block execution until the OS version is reconciled, or proceed using the 10.12 adapter path. The right answer depends on the team’s change management policy, but the platform needs both data points to make the decision.
The device is authoritative for its own version (hard to argue about it), so the Executor reads the running version from the device in a lightweight pre-execution check, and adapts the execution for planning and reporting. The adapter registry then maps OS version ranges to adapter implementations, and the Executor invokes the adapter for the version it just read, not the version the SoT intends. Once a device is upgraded and the running version matches intent, the adapter selection stabilizes. During the migration window, two adapter paths for the same vendor may be active simultaneously.
The implementation example in the Implementation Example section demonstrates this pattern directly: the Vendor C adapter bug was triggered because one firmware version returned vlan-exists and another returned duplicate-vlan for the same condition. The fix was per-OS-version error handling in the adapter registry. Any automation platform managing a multi-version fleet will encounter this class of problem. Encoding per-version adapter logic, driven by the OS version read from the device at execution time, is the systematic mitigation.
Of the three functionalities in this chapter, I only cover one in the solutions landscape. The network’s interfaces are given to you, and the tooling behind the abstraction strategies is covered in Chapter 4 and Chapter 6. Simulation is the part you install.
Solutions Landscape#
This landscape covers the lab orchestration tools that build the simulation environment. They take a topology description, start the network OS images, wire the virtual links between them, and tear the whole thing down when the test finishes. That is what makes a lab disposable, and a disposable lab is what makes it usable in a pipeline, as well as for training network engineers. Every block of the automation platform can run against it.
Three questions separate the lab tools from each other. Does it run container images or full virtual machines? Does it expose an API a pipeline can call, or a GUI an engineer drives? And does it describe the topology at the wiring level, which node connects to which port, or at the service level, which nodes run BGP?
| Tool | Environment model | What makes it architecturally different | Network automation fit |
|---|---|---|---|
| containerlab | Container images, declarative topology file | Orchestrates Docker containers (Arista cEOS, FRR, SONiC, VyOS, and others) and wires them with virtual links. The de-facto standard for container-based network labs. A topology starts in seconds. | The routine CI/CD gate: the same workflow code runs against a lab topology on every change |
| clabernetes | containerlab distributed over Kubernetes | Spreads containerlab topologies across a cluster instead of one machine, so simulation runs go in parallel rather than in a queue. | Teams whose single lab host has become the bottleneck |
| netlab | Service-level topology, rendered into containerlab | Describes what the topology should accomplish, “these three nodes run BGP”, “these nodes share a VLAN”, and generates both the containerlab file and the per-vendor initial configuration. | Labs that mirror a production network model without hand-wiring every link |
| vrnetlab | Vendor VM images wrapped as containers | Makes a VM-only platform usable inside a containerlab topology, which is how an IOS-XR or Junos node joins a container-based lab. | Vendors that publish no container image |
| EVE-NG / GNS3 | Full VM emulation, GUI-driven | Broad vendor coverage and full-NOS behavior including the data plane, with GUI topology design. The cost is resource usage, startup time, and limited pipeline integration. | Protocol and design testing, legacy platforms, multi-vendor interoperability |
| Cisco Modeling Labs | Commercial VM lab with a REST API | A managed, shared VM lab that can be driven by an API, which is where EVE-NG and GNS3 stop at the GUI. | Cisco-centric environments needing IOS-XE, IOS-XR, and NX-OS VMs |
The tools listed here are examples for explanatory purposes, not recommendations. Each makes a different bet about fidelity, speed, and automatability. Evaluate them against your team’s capabilities, existing tooling, and the environments you actually need to reproduce.
One question cuts across them: can a pipeline start the topology without a human in the loop? containerlab, clabernetes, netlab, and vrnetlab all can, which is why those are the ones that end up in CI/CD. EVE-NG and GNS3 are GUI-first and belong to the design workflow rather than the commit workflow. Cisco Modeling Labs sits between the two. A team that wants a pre-production gate on every change needs at least one tool from the first group, whatever else it runs alongside.
The second question, wiring level or service level, is easier to see in code than to describe. A containerlab topology states which node connects to which port:
name: building-b-sim
topology:
  nodes:
    cisco-1:
      kind: cisco_cat9kv                      # VM-backed: no vendor container
      image: vrnetlab/cisco_cat9kv:17.9.4
    arista-1:
      kind: arista_ceos                       # native container image
      image: ceos:4.31.2F
  links:
- endpoints: ["cisco-1:eth1", "arista-1:eth1"]The same two nodes in netlab state what the topology is for, and netlab renders the wiring and the initial per-vendor configuration from that on top of a virtualization solution like containerlab:
nodes:
  cisco-1:
    device: iosvl2
  arista-1:
    device: eos

links:
  - cisco-1:
    arista-1:

vlans:
  app-payments:
    id: 412
links: [ cisco-1, arista-1]A rough starting point. containerlab alone covers most teams, because the images that matter are all reachable from it, vendor VMs included once vrnetlab wraps them. Add netlab when writing topology files by hand becomes the work rather than the setup. Add clabernetes when one host stops being enough.
Tools change faster than the problem they exist to work around, and the problem is easiest to see in one run, end to end.
Implementation Example#
We have followed the same campus network through all of Part 2. The VLAN service request for app-payments was modeled in Chapter 4, stored in the Source of Truth in Chapter 5, applied by the Executor in Chapter 6, validated by Observability in Chapter 7, coordinated end to end by the Orchestrator in Chapter 8, and surfaced to three audiences in Chapter 9. Every one of those chapters assumed the device on the other end would behave the way its documentation says. This is where that assumption gets tested, before production pays for it being wrong.
Scenario: The campus VLAN workflow is ready. Eight weeks of development, three vendors modeled, idempotency tested against a three-node lab. The team wants to deploy to 800 switches across buildings A through F. Before any of that, the workflow runs against a simulated Building B: 24 switches, 8 of each vendor, with every image pinned to the OS version the SoT records for that device.
Requirements:
- Build the simulation topology from the Source of Truth, not by hand
- Pin every image to the OS version the SoT records for that device
- Run the same workflow code that will run in production, with no simulation-only branches
- Assert observed state after the run, not the workflow’s exit code
- Catch a vendor-specific interface failure before any production device is touched
- Expand to production in waves once simulation passes, not in one operation
Blocks involved:
- Source of Truth: holds the Building B inventory, the intended OS version per device, and the VLAN state the simulation has to start from
- Orchestration: runs the same workflow against the simulation target that it will later run against production, and compensates when a step fails
- Execution: applies the configuration through the per-vendor adapter, which is where the bug turns out to be
- Observability: supplies the post-change state each gate asserts against
- Presentation: carries the request in and the outcome back out, unaffected by any of this
- The Network:
- Programmable Interfaces: NETCONF and gNMI on all 24 nodes, and the per-vendor error semantics behind them
- Simulation and Testing Environments: netlab over containerlab, with the Vendor C nodes pinned to the production firmware line
- Abstraction Strategies: an adapter registry that branches by vendor and by OS version
Unlike the rest of Part 2, this example names tools. The point of it is that image fidelity decides the outcome, and that cannot be shown with generic boxes. Any equivalent tool from the Solutions Landscape section plays the same role. The device platforms stay generic, as they do across Part 2: Vendor A, Vendor B, and Vendor C. What matters is that there are three of them, and that one of them disagrees with its own documentation.
Implementation Flow#
The run takes six steps, and only the last one touches production. Figure 10.5 shows the path, including the failure that sent it back through a fix; the list below walks through each step.
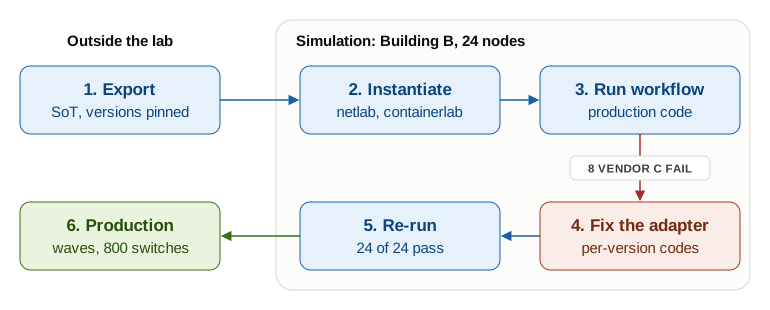
Export the topology from the Source of Truth. The SoT holds the Building B inventory with an intended OS version per device: 8 Vendor A switches on release 17.9.4, 8 Vendor B on 4.31.2, and 8 Vendor C on 10.12.1006, an older firmware line that predates that vendor’s 10.13. The export produces a netlab topology definition carrying node types, vendor image tags mapped to those intended versions, and the VLAN state the simulation should start from: VLANs 409, 410, and 411 already configured on every switch, matching production. That last detail is what makes 412 the right ID to test with, because Chapter 4 allocates the next free one in the range reserved for the building.
Instantiate the simulation environment. netlab renders the export into a containerlab topology file. containerlab runs on a shared Linux host in the team’s CI/CD environment. Sizing it is the unglamorous part. Only one of the three platforms ships a native container image, at roughly 2 GB per node; the other two are vendor VMs wrapped by vrnetlab, at 4 to 6 GB each. Twenty-four nodes in that mix needs a 192 GB bare-metal server, not the 64 GB the node count suggests. The Vendor C nodes run an image pinned to 10.12.1006, matching the SoT rather than whatever the vendor ships today. All 24 nodes are up and answering NETCONF and gNMI within three minutes, most of which is the VM-backed nodes booting.
Run the production workflow against the simulation target. The Orchestrator triggers the Chapter 8 workflow with the simulation inventory as the target scope instead of the production inventory. Nothing else about the workflow changes, which is the condition that makes the result mean anything. The first three steps complete: the SoT records are checked for completeness, the pre-check confirms VLAN 412 does not exist on any of the 24 nodes, and the approval gate passes under the simulation target’s own policy, which names the pipeline as its approver. That is configuration, not a branch in the workflow.
The fourth step, the deploy fan-out across all 24 simulated switches through the Executor, returns failures. 8 Vendor A nodes pass. 8 Vendor B nodes pass. 8 Vendor C nodes fail, all with
vlan-exists. The idempotency check in the Vendor C adapter treatsduplicate-vlanas a no-op and has no handler forvlan-exists, so the Executor reports failure. A third of the scope failing is far beyond the change’s threshold, so the Saga compensation removes VLAN 412 from every node that had received it.No production device has been touched. The failure cost is container startup time and a thirty-minute investigation.
Diagnose and fix. Vendor C’s 10.12 release notes explain it.
vlan-existswas introduced in 10.11.1, replacingduplicate-vlanfor duplicate VLAN detection, and 10.13 reverted toduplicate-vlanfor consistency with the rest of that vendor’s range. The fix is to addvlan-existsto the idempotency error code list in the Vendor C adapter, keyed by OS version: 10.11 through 10.12.x returnsvlan-exists, 10.13 and later returnsduplicate-vlan. The adapter registry now branches on the running version rather than assuming one.Before re-running, the team adds the expected post-change state to the simulation gate: after the workflow completes, VLAN 412 exists on all 24 nodes and the Saga compensation did not fire. It is the same kind of state check the wave gates in Chapter 8 run, and the gate closes only when the workflow completes and the check passes.
Re-run in simulation. The corrected adapter runs against the same containerlab topology. All 24 nodes pass, the Saga completes without compensation, and the SoT shows VLAN 412 present on every Building B node.
Expand to production in waves. A closed simulation gate earns the first wave, not the whole fleet. The Orchestrator runs the same workflow against Building B in production, 24 switches, and the wave gate asserts the four checks from Chapter 8 against the Observability layer rather than against the devices. It passes. Two more buildings follow, then the remainder: 800 switches across buildings A through F, zero failures on the Vendor C nodes. The application team’s ticket closes when the Orchestrator completes, and Observability confirms VLAN 412 on every expected interface inside the convergence window.
Solution Summary#
The simulation environment is not a verification step to skip when the team feels confident. It is the gate that runs before the production Saga begins, and on this run it was the only thing standing between a documented firmware quirk and a maintenance window spent auditing which switches had actually been configured.
What made the catch possible was fidelity, not cleverness. The OS version in simulation matched production because the SoT recorded what production runs, and the platform ran the exact same workflow code against it. A topology built from the latest vendor images would have passed clean, and the bug would have surfaced at 02:00 on the production fleet. The investment is containerlab setup, version-pinned images, and a SoT export mechanism. The return is finding device-specific bugs while they are still cheap.
All seven building blocks appear in this run, as they have throughout Part 2. The SoT supplied the topology and the version intent, the Orchestrator ran the workflow and compensated the failure, the Executor applied the change through the adapter that had the bug, Observability supplied the data each wave gate judged, and Presentation carried the request in and the outcome back. The Network is the one block the team did not build, and it is the one that decided how the first attempt went.
Chapter 11 covers how to operationalize simulation environments as part of the platform: keeping containerlab topologies in version control, syncing them with SoT exports on a schedule, and wiring them into CI/CD pipelines so the gate runs automatically on every workflow change.
One VLAN, one firmware quirk, and all seven blocks doing their part. The summary steps back from the example to what this chapter, and Part 2 as a whole, leave you with.
Summary#
This chapter closes Part 2 by addressing the block the automation platform was always pointing at: the network itself.
Three ideas anchor the chapter.
The network is not uniform. Any large-scale automation platform interacts with campus switching, data center fabric, cloud VPCs, Kubernetes overlays, overlay controllers, and legacy gear simultaneously. Each exposes a different interface, operates under different consistency semantics, and has different automation maturity. The platform absorbs this heterogeneity through the interface selection hierarchy (gNMI or NETCONF first, REST as fallback, CLI as last resort), OS version tracking in the Source of Truth, per-platform translation in the component layer, and per-interface adapters in the Executor.
Simulation environments are the pre-production gate. Container-based emulation provides realistic, fast, CI/CD-integrated environments where automation logic is tested against topology and OS versions that mirror production. Failures in simulation are cheap. Failures in production are expensive. Fidelity of the simulation environment to production state is what makes the gate meaningful.
Abstraction strategies extend platform lifetime. The Adapter Pattern handles today’s multi-vendor physical environment. OpenConfig and YANG translation push toward vendor-neutral models that reduce how much per-platform translation the component layer carries. SONiC collapses the vendor axis entirely for platforms that support it: one translation and one adapter, whatever the hardware. None of these strategies provides a perfect answer; each involves tradeoffs between uniformity and feature access. The right choice depends on the team’s device catalog, operational capacity, and how much of their automation work falls within the standard feature coverage.
With this chapter, Part 2 is complete. Seven chapters have covered the seven building blocks of the NAF framework, though two of them do not map one to one: Intent and the Source of Truth take two chapters between them, while the Collector and Observability share one. Execution, Orchestration, Presentation, and The Network take a chapter each. These are not independent tools. The SoT feeds the Executor with the intent it needs and the Collector with the expected state to validate against. The Orchestrator sequences both, handles failure, and surfaces progress to the Presentation layer. The Network sits beneath all of them: the constraint that shaped the design of every other block, and the place where automation ultimately produces a result or fails.
Part 3 turns from building the blocks to operating the platform at scale: engineering for reliability, designing for security and compliance, and treating the automation platform as a product with its own lifecycle and operational requirements.
References#
- Network Programmability with YANG, Benoit Claise, Joe Clarke, and Jan Lindblad (Addison-Wesley, 2019). The definitive reference on YANG data modeling: how IETF and OpenConfig models are structured, and how NETCONF and RESTCONF use them.
- Network Programmability and Automation, 2nd Edition, Matt Oswalt, Christian Adell, Scott S. Lowe, and Jason Edelman (O’Reilly, 2023). The most comprehensive practical guide to network automation tooling, covering NETCONF, gNMI, YANG models, and automation frameworks in depth.
- Infrastructure as Code, 2nd Edition, Kief Morris (O’Reilly, 2021). Foundational for understanding how repeatable, testable, version-controlled infrastructure applies directly to network automation platform design.
💬 Found something to improve? Send feedback for this chapter