Orchestration#
The network team had done everything right. They had a solid Source of Truth, well-tested playbooks for every operation, and a clear runbook to execute them. On paper, deploying a new VLAN service was fully automated. In practice, it took half a day and one specific engineer.
That engineer knew the sequence. First, validate the SoT data was complete. Then run the pre-check playbook. Then review the output, look for failed devices, and decide whether to continue. Then trigger the deployment playbook. Then wait. Then run the validation playbook. Then update the ticket manually. If any device failed partway through, roll it back before the others noticed. She had it all in a runbook, step by step, in a shared document that nobody else had fully internalized.
When she went on leave, deployments stopped. When a junior engineer tried the sequence and got the order wrong, the network was left in a partial state for six hours. The automation existed. The coordination was still manual.
That is the problem this chapter solves. Orchestration is the building block that turns a collection of automation tools into a system that behaves as one. It coordinates the other blocks, decides when they run, handles failures gracefully, tracks every decision, and does all of this without an engineer standing in the middle managing the flow by hand.
Fundamentals#
Every building block we have covered so far does one thing well. The Source of Truth holds intent. The Executor applies it. The Collector retrieves state. Observability makes sense of that state. Each one is a specialist, and specialists need a connector: something that decides when each should act, what to do with the result, and how to recover when something goes wrong.
That connector is the Orchestrator.
In Chapter 3 we placed it at the center of the NAF framework as the block that coordinates all the others. This chapter shows how the Orchestrator sequences the Source of Truth, the Executor, and Observability, and handles everything that can go wrong between them.
Without orchestration, you are not running automation. You are running scripts that someone has to invoke in the right order, at the right time, and interpret the right way. That is automation in name only.
The Orchestrator needs to fulfill five goals:
Coordinate multi-block workflows end-to-end. A deployment is not a single action; it is a sequence: validate intent in the SoT, run pre-checks, execute configuration, validate the result, notify stakeholders. The Orchestrator holds the full sequence together.
React to events automatically, with or without human initiation. A service portal approval, an Observability alert, a scheduled compliance scan: all of these should be able to trigger a workflow without a human manually starting it.
Resilient and scalable execution. A workflow touching 800 switches in parallel must complete reliably. It must survive a restart. It must handle partial failures without losing the work done by the devices that succeeded.
Provide tamper-evident visibility. Operators need to see what is running right now. Auditors need to see what ran last month, who triggered it, which version of the workflow ran, and what every step produced. Both needs must be met from the same system.
Manage workflow definitions as production software. A workflow that deploys to 800 switches cannot be changed casually. The logic itself needs to be persisted, versioned, tested, and promoted to production with the same discipline applied to any code running in production.
What’s in scope
- Coordinating other building blocks
- Defining workflow logic and step dependencies
- Handling triggering from multiple sources
- Tracking workflow state and producing audit trails
- Managing rollback decisions when steps fail
What’s out of scope
- Executing device changes (that is the Executor)
- Storing network operational state (that is Observability)
- Holding network intent (that is the Source of Truth)
A common mistake is building an Orchestrator that duplicates the execution or storage responsibilities of its neighbors. The interface between blocks must stay clean.
An Orchestrator that also stores credentials, manages device inventory, or runs its own configuration engine has grown into something else. If your orchestration tool starts absorbing responsibilities from other blocks, you have an architectural coupling problem that will be expensive to untangle later.
The scope tells you what the Orchestrator owns. The next question is what it needs inside that boundary to meet its five goals.
Functionalities#
Five core functionalities deliver the five goals, one each, as Figure 8.1 shows.
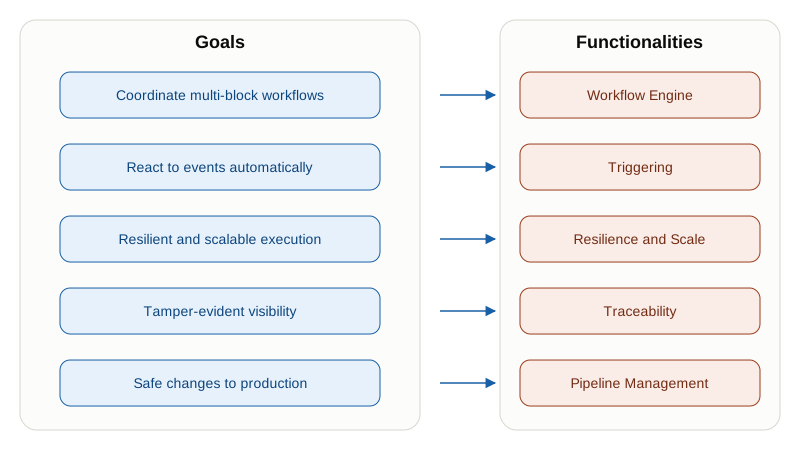
- Workflow Engine: how workflows are structured and how steps coordinate. It defines a multi-step process, runs it, and tracks it as one unit rather than as a pile of separate jobs.
- Triggering: how and when workflows start, and what the caller experiences. Manual, scheduled, event-driven, or webhook, each with a different expectation about how long the caller waits.
- Resilience and Scale: how workflows complete reliably under failure and at volume. The workflow survives a restart, retries and rolls back where it has to, and runs concurrently across hundreds of devices without a per-device bottleneck.
- Traceability: tracking workflow state and producing tamper-evident audit records, so every step is logged and every decision is traceable long after the run.
- Pipeline Management: treating workflow definitions as production software. Persist them, version them, and promote them to production safely.
Each functionality gets its own section, in that order, starting with the engine everything else hangs off.
Workflow Engine#
The workflow engine is the core of the Orchestrator. It defines multi-step processes, executes them, tracks their state, and handles the relationships between steps.
Before going into patterns, it is worth naming the four fundamental coordination approaches, because this choice shapes everything else. Figure 8.2 shows them side by side.
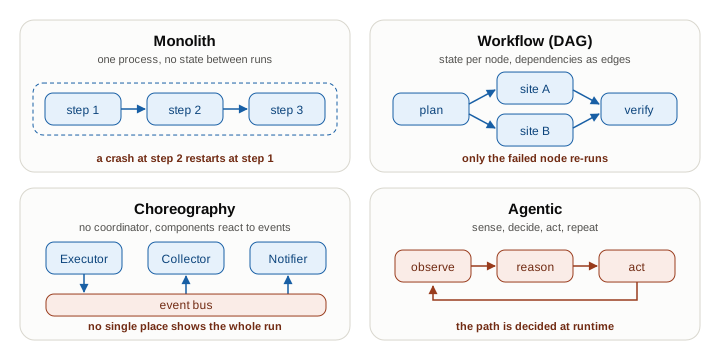
Monolith (imperative program): A single script (e.g. with Python or Go) calls each step in sequence, waits for each result, and decides what to do next. Simple to write, and many teams start here. The problem is durability: if the script crashes at step 5 of 10, you restart from the beginning. There is no persistent state between runs. You also cannot parallelize steps without writing threading logic yourself. It works for small, fast operations; it breaks under load and unreliable infrastructure. In practice, this is what the Executor block already provides: a script invoked by an operator. Calling it orchestration is generous.
Workflow (DAG-based): This is where orchestration genuinely begins. Steps are defined as a directed acyclic graph, where each node is a task and edges express dependencies. The engine tracks state per node: if you restart after a crash, only the failed or incomplete steps re-run. Parallelism is built in: independent branches execute concurrently. This is the dominant approach for production orchestration, and the most proven for network automation. The Solutions Landscape section later in this chapter compares the tools in this category.
Choreography (event-driven, no central coordinator): There is no Orchestrator. Each component reacts to events published by others: the Executor publishes “deployment complete,” the Observability system consumes it and runs validation, the notification system consumes the validation result. The coupling between components is loose, which makes it easy to add new consumers. The downside: there is no single place to understand the full workflow state. Debugging cross-service failures requires correlating events from multiple systems. This approach works for simple reactive patterns but becomes complex at scale.
Agentic (sense-logic-act loop): An AI system acts as the logic layer. The agent observes current state (from Observability or SoT), reasons about what action is needed, and invokes the Executor. Rather than following a predefined workflow graph, it makes decisions dynamically at runtime. This is the approach that trades determinism for flexibility and forms the architectural foundation for autonomous networks. The Agentic Orchestration section covers it in depth; Chapter 18 extends it to full autonomy.
Most teams start with the Monolith approach and graduate to Workflow (DAG-based) as their automation matures. Choreography is harder to get right for network operations: it needs a solid answer for audit and traceability, and a central coordinator gives you that answer almost for free. Agentic approaches are real but not yet the default for production network operations.
Choreography deserves a closer look, because many teams are already doing it without having chosen it. If an Observability alert lands on a message bus, a remediation service consumes it and calls the Executor, and a notification service consumes the result, you have a choreographed workflow. Nobody designed it as one. It grew, one subscriber at a time.
The symptom is diagnostic rather than architectural. When a remediation does not happen, no single system can tell you why: you check whether the alert fired, then whether it was published, then whether the consumer was running, then whether it called the Executor, then whether the Executor failed. Every component logged its own part correctly, and no component holds the run. That is the trade. Choreography buys loose coupling and the freedom to add a consumer without touching the producer, and it costs you the one thing an orchestrator gives you for nothing: a single place to look.
DAG Workflow patterns#
Within the DAG-based approach, three patterns cover most real-world network automation workflows, shown in Figure 8.3:
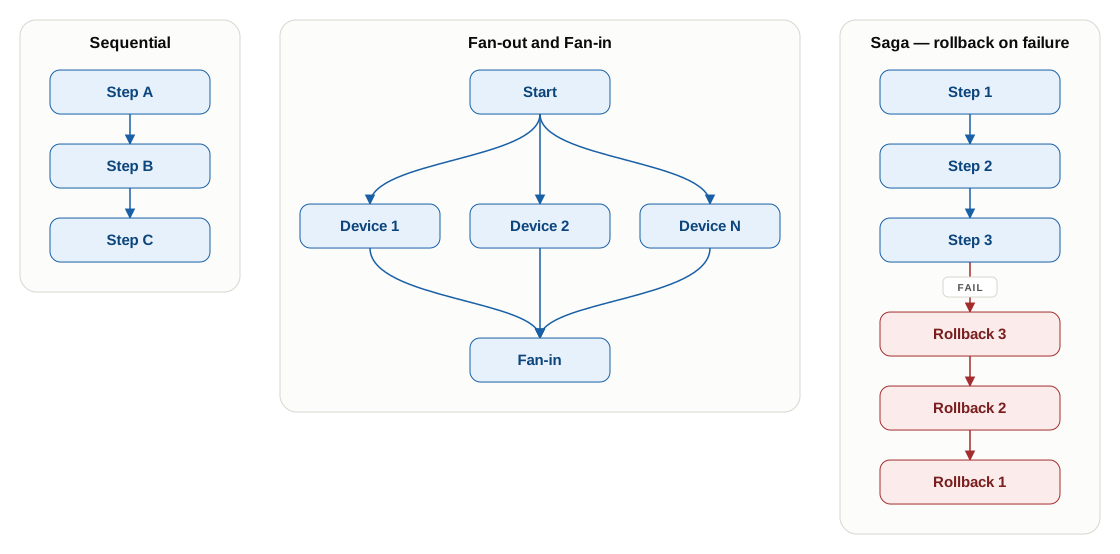
Sequential: Steps run one after another; each depends on the previous completing successfully. Appropriate when strict ordering is required: validate intent, then pre-check, then execute, then verify.
Parallel (fan-out/fan-in): Multiple independent steps execute concurrently. A fan-out step launches many parallel tasks (one per device, or one per building); a fan-in step waits for all of them to complete before proceeding. Essential for operations across hundreds of devices: without fan-out, a 10-second per-device operation across 800 devices takes over two hours sequentially.
Saga Pattern: For long-running workflows, every step carries a compensating action, so a failure partway through can be unwound instead of left half-applied. This is how rollback works at the orchestration level: not by re-running the whole workflow, but by executing the inverse of each step that succeeded. The Rollback and compensation section covers the mechanics and what they cost to build.
The Saga Pattern is also the structural basis for progressive wave rollout: deploying network changes in waves rather than all at once. Wave 1 covers a small test population; if it succeeds, the workflow fans out to Wave 2, then Wave N. If any wave fails, compensation rolls back only that wave. This is the network equivalent of a Canary Deployment: the same controlled promotion discipline software teams apply to code releases, applied to network changes. Chapter 11 covers how the platform sizes waves, snapshots them, and enforces progression, and the Validating health at each wave gate section later in this chapter covers the gate between waves.
Conditional branching is not a fourth pattern. It is a property all three can have: the path taken depends on runtime state. Did the pre-check pass? Branch to execution. Did it fail? Branch to abort and notify. A sequential workflow branches between steps, a fan-out branches per device, and a Saga decides whether compensation is needed at all. Whatever the shape, the workflow definition carries decision nodes that evaluate a result and choose what runs next.
All three patterns fit in one definition. This is the core of the campus VLAN workflow from the Implementation Example section: three steps in sequence, each one a batched fan-out, with a Saga hook on the step that changes the network.
workflow: vlan-service-deploy
steps:
  - id: pre-check
    run: executor.precheck
    fan_out:
      over: inputs.devices
      batch_size: 50           # concurrency control, not parallelism for its own sake
      failure_threshold: 0.10  # abort if more than 10% of devices fail the pre-check

  - id: deploy
    needs: [pre-check]
    run: executor.apply
    fan_out:
      over: steps.pre-check.output.reachable
      batch_size: 50
      failure_threshold: 0.05  # an additive VLAN tolerates a few stragglers; a security change would be 0
    compensate: executor.remove_vlan

  - id: validate-result
    needs: [deploy]
    run: observability.assert_state
    fan_out:
      over: steps.deploy.output.changed
delay: 60s # convergence window before asserting anythingRead the needs keys and the graph is visible: every step names what it waits for, and the engine derives the order rather than the author writing it. fan_out is where the parallel pattern lives, and the two parameters next to it are the ones that matter operationally. batch_size bounds how much of the network changes at once. failure_threshold decides when to stop, and it differs per step on purpose, for the reasons the Concurrency control section gives. The compensate key on deploy is the Saga hook, covered below.
Dependency management#
Workflow steps rarely exist in isolation. The engine needs to express and enforce three kinds of dependencies:
Data dependencies: Task B cannot start until Task A completes and produces a result that B consumes. The engine passes outputs between steps as structured data. In practice this means the pre-check step passes the list of reachable devices to the execution step, rather than re-querying from scratch.
Multi-input dependencies (fan-in): A step waits for multiple parallel branches before proceeding. The engine holds state for each branch and triggers the join step only when the configured completion policy is met: all completed, or N of M, or first success.
External dependencies: Sometimes a step cannot proceed until something outside the system happens. A change window opens. A human approves. A device becomes reachable after a reboot. The engine must support waiting states with configurable timeouts and defined escalation paths for when the wait never resolves.
Dependencies decide what runs after what. The next question is what makes a workflow run at all.
Triggering#
A workflow has to start somehow. Triggering answers two questions: what causes a workflow to begin, and what does the caller experience after it does.
How triggering differs from Chapter 6: In Chapter 6, triggering referred to how an operator or system invokes the execution engine directly: an API call to the execution engine, a template launch from a Command Line Interface (CLI). That is execution-layer triggering. Here, triggering describes what causes the Orchestrator to initiate a workflow, which may in turn invoke the Executor as one of several steps. The Orchestrator receives the trigger and decides what full workflow to run. The Executor just executes what the Orchestrator tells it to.
Three modes cover the full spectrum from human to fully automated:
API call: The orchestrator exposes an HTTP endpoint. An operator calls it manually, a UI button calls it, or an external system calls it when an event occurs: a service portal, the Source of Truth, a CI/CD pipeline. These are the same mechanism: what differs is who initiates the call and whether it carries structured event data. Appropriate for any change that needs to start now, whether the initiator is a human or a system.
Scheduled: A cron-like schedule starts a workflow at a configured time. Nightly compliance scans, weekly firmware audits, monthly capacity reports. Most orchestrators support this natively; some teams use an external scheduler and call the orchestrator API.
Message queue: The Orchestrator consumes messages from a queue (Kafka, NATS, RabbitMQ) and starts a workflow per message. This decouples the event producer from the orchestrator: the producer publishes and moves on; the orchestrator processes at its own pace. Appropriate for high-volume event streams where delivery-at-most-once guarantees from direct API calls are insufficient.
The choice between push (API call) and pull (message queue, scheduled) depends on volume and coupling tolerance. API calls are simpler but require the sender to know the orchestrator’s endpoint. Message queues scale better for high-volume streams but add infrastructure to operate.
Once a workflow starts, the caller needs to know what to expect back, and that comes in three flavours:
Synchronous: The caller waits until the workflow completes and receives the result directly. Appropriate for short operations (under 30 seconds) where the caller needs the result to proceed. Most interactive use cases start here and discover they have outgrown it when they try to run a 10-minute deployment and the API client times out.
Asynchronous: The caller receives a workflow run ID immediately and polls for status, or registers a callback URL to receive the result when complete. Required for any workflow that touches more than a handful of devices. This has a direct implication for how the system surfaces status: the Presentation layer (Chapter 9) must expose status endpoints and push notifications, because users triggered workflows from somewhere and need a way to track them without holding an open HTTP connection.
Hybrid: The workflow starts asynchronously, but the caller can optionally block on a sync-wait endpoint if needed. A convenience pattern that avoids forcing callers to choose upfront.
Idempotency in event-driven workflows: When Observability fires an alert or a SoT change event fires, multiple systems may react simultaneously. The same alert can fire twice; a message queue may deliver the same message more than once. Every event-driven workflow must be idempotent: running it twice against the same input must produce the same result as running it once. At the orchestration level, this typically requires a deduplication key: a unique identifier the orchestrator checks before starting a new run. If a run with that key already exists and is still running, reject or queue the duplicate. This sounds simple and is surprisingly easy to get wrong in practice.
The Self-Healing Pattern: Observability detects a drift condition (a device configuration has diverged from intent). It fires an alert to the Orchestrator via the triggering mechanisms above. The Orchestrator starts a remediation workflow: queries the SoT for the expected state, invokes the Executor to correct the device, and then re-runs an Observability check to confirm the fix. If the check passes, the loop closes. If it fails, the Orchestrator escalates. This pattern is the foundation of self-healing automation and is covered in depth in Chapter 17. The loop only works if the Orchestrator, Observability, and Executor are decoupled enough that each can play its role independently.
Triggering decides when a workflow starts. The next question is whether it survives everything that happens after that.
Resilience and Scale#
This is what separates an orchestrator you prototype with from one you trust at 3am in production. A workflow that runs reliably under ideal conditions tells you nothing about whether it will survive a coordinator restart mid-run, handle 40 of 800 devices failing pre-checks, or degrade gracefully when a dependency never resolves. The next time your orchestrator is tested, it will not be in a demo.
Resilience at the execution layer, covered in Chapter 6, addresses idempotency and retry at the individual device level: if a playbook fails against one device, retry it. What Chapter 6 does not address is workflow-level durability: what happens when the Orchestrator itself restarts mid-run, when 40 of 800 devices fail pre-checks, or when a dependency never resolves and the workflow hangs. Scaling the orchestrator itself, including high availability, horizontal workers, and database load under concurrent runs, is an infrastructure concern addressed in Chapter 12.
There are six key patterns to increase resiliency:
Durable state#
A workflow engine that stores workflow state in memory loses everything on restart. This is acceptable for scripts, but unacceptable for production orchestration. Durable state means the workflow’s progress survives the orchestrator’s failure: which steps completed, what they produced, which are still pending. When the orchestrator comes back online, it resumes from where it left off.
Solutions reach that guarantee in different ways. Some replay the workflow function from its recorded event history on restart, which makes in-flight state crash-proof. Others persist job state to a database and resume from the last committed step.
Make that concrete. A deployment fans out to 800 switches in batches of 50, and the orchestrator process dies after batch six. On restart the engine reads its own record: batches one to five committed, batch six was dispatched and has no result. It does not re-run one to five. It re-runs batch six, the part it cannot account for.
That re-run is only safe because of the device-level idempotency Chapter 6 insists on: pushing the same VLAN definition to a switch that already has it changes nothing. Durable state at the orchestration layer and Idempotency at the execution layer are the same guarantee seen from two heights, and neither works without the other. If the Executor is not idempotent, clean resumption just reapplies a change to devices that already took it, and you find out which of your playbooks are less repeatable than you believed.
Retry strategies#
Not all failures are equal. A device that was briefly unreachable during a firmware reboot should be retried. A device that returned a permanent authorization error should not: retrying will not help and may trigger lockout policies.
Retry configuration should distinguish:
- Transient failures: network blips, API timeouts, temporary resource contention. Retry with exponential backoff.
- Permanent failures: bad credentials, device in maintenance mode, configuration that does not apply to this device type. Abort and escalate.
The workflow definition should specify retry policy per step, because a pre-check and a configuration push fail differently. A pre-check reads, so five attempts cost nothing, and a device that stays unreachable is skipped rather than fatal. A push writes, so it gets one attempt. A push that timed out may have applied, and retrying blind is how one device ends up with the change twice, or with half of it.
Rollback and compensation#
When a deployment workflow fails partway through, you have three options: leave the partial state, fix it manually, or roll it back automatically. In most network operations, partial state is dangerous: devices that received the new configuration will behave differently from devices that did not.
The Saga Pattern addresses this. Each step declares its compensating transaction, and if the workflow succeeds up to step N and then fails, it runs the compensating actions for steps N-1 through 1 in reverse order. In a VLAN deployment: the workflow reserves VLAN 412 in the SoT, the deploy step pushes it to the 24 switches in Building B, and the verification step that follows fails. The Saga runs the deploy step’s compensation, removing the VLAN from those 24 switches, then releases the reservation, and only then reports failure. Note the level. A device that fails in the middle of the deploy step is restored by the Executor’s own rollback (Chapter 6), inside that one task. The Saga works one level up, on whole steps that had already completed.
The Saga Pattern requires that compensating transactions be defined in advance, at workflow design time. This is extra work upfront. The alternative is discovering at 2am that your network is in a state that no runbook describes.
# Every step that changes something declares how to undo it. The engine runs
# these in reverse order, and only for the steps that actually succeeded.
steps:
  - id: reserve-vlan-id
    run: sot.allocate_vlan
    compensate:
      run: sot.release_vlan
      args: { vlan_id: "{{ steps.reserve-vlan-id.output.vlan_id }}" }

  - id: deploy
    run: executor.apply
    compensate:
      run: executor.apply                            # the inverse of a declarative push
      args:                                          # is another declarative push
        state: absent
        scope: "{{ steps.deploy.output.changed }}"   # only the devices that took it
on_failure: halt_and_pageThree things in that definition are easy to get wrong. The compensation for a declarative push is another declarative push with state: absent, not a reversed list of commands, which is why device-level idempotency is a prerequisite rather than a nicety. The scope is the devices that actually changed, not the devices the step targeted, because rolling back a device that never took the change is a change nobody asked for. And on_failure: halt_and_page is deliberate: if the rollback itself fails on a device, continuing leaves a fleet in two states with no record of which is which, and that is worse than stopping with a known problem and a name attached to it.
Validating health at each wave gate#
Gating each wave on evidence is one of my favorite patterns for earning trust on critical deployments, because a gate that passes is evidence rather than optimism. A gate between waves is a workflow step like any other, which is why it lives in this chapter. It runs a set of assertions, and when they fail, the Saga compensates that wave and stops the rollout. Testing frameworks fit here for the same reason: a test suite is a workflow, and its verdict is a branch decision.
The gates form a sequence: simulation, then a pilot wave, then progressively larger waves, with a health check between each one deciding whether the next wave is released. Simulation, the gate before the first wave, belongs to the network and Chapter 10 covers it. The note in the DAG Workflow patterns section named the rollout pattern, and the Saga Pattern’s per-step compensation is what makes it safe: a failed wave rolls back only that wave. Chapter 11 covers the deployment mechanics: how waves are sized and scoped, how the platform snapshots each wave before changing it, what an abort threshold looks like, and how progression is enforced.
This section covers the gate itself: what “healthy” means after a wave, and how the workflow asserts it. The Orchestrator owns the gate and its decision; Observability supplies and analyses the data the gate judges. Whether a device supports a given interface protocol or YANG path at all is a separate question, covered in Chapter 6 for configuration interfaces, Chapter 7 for collection paths, and Chapter 10 for the network itself.
Start with what a health check has to prove. A gate that checks only whether the configuration push returned success proves almost nothing. In the opening story of Chapter 10, one firmware release answered vlan-exists for a VLAN that was already there, and the switches running it returned failure for a change that had been applied, and a device can just as easily return success for a change that did not take effect. A health check asserts observed state, never the result of the write.
Chapter 6 already defines verification in three levels, in increasing order of what each one proves and what it costs: config state, operational state, and service state. A wave gate runs all three. It also adds a fourth check that only matters when the next thing you do is widen the scope.
Config state. The object the workflow was supposed to create exists, with the attributes it was supposed to have. VLAN 412 is in the VLAN table on every switch in the wave, named
app-payments, allowed on the expected uplinks. This proves the device accepted the configuration, and nothing more.Operational state. The device acted on it: the VLAN is active, the member interfaces are up, the trunk is forwarding it. This is the level that story failed at, because a device that reports
vlan-existsand a device that reports success can both be sitting on the right operational state or the wrong one, and only this check tells you which.Service state. A host in VLAN 412 reaches its gateway. This is the only assertion that proves the change did what was asked for, and it is the one most often skipped, for a reason worth taking seriously: it needs an endpoint inside the target VLAN, and that endpoint costs more than it looks. An address per VLAN, a reachable host or small VM per site, monitoring for the test endpoints themselves, and a security exception, because a host that can reach gateways across every tenant VLAN crosses the segmentation boundaries Chapter 13 spends a section defending.
The practical compromise is coverage rather than completeness: test endpoints at a handful of representative sites, one per VLAN class rather than one per VLAN, inside the same segmentation policy as the users who will land there. Be explicit about what the compromise leaves uncovered. Reaching an SVI proves the trunk path and the gateway; it does not prove the DHCP scope exists, or that 802.1X authorizes a real supplicant onto the new VLAN, and on a campus floor those are what actually break for users. Where no endpoint is possible, say so in the gate definition rather than quietly dropping the assertion, so everyone knows the gate certifies configuration and not connectivity.
Nothing else moved. The change did not disturb what was already working. Interface error counters flat against the pre-change baseline, no interface that was up before now down, BGP session and spanning tree neighbor counts unchanged.
The fourth one is the wave gate’s own addition, and it is worth being clear about why the other three do not cover it. Levels 1 through 3 ask whether the change worked. This one asks whether anything else broke, which is a question you can only answer for a bounded scope against a known baseline, and a wave is the first time you have both. It is also the question that decides whether widening the scope is safe, which is the only decision a wave gate exists to make.
Run all four after a convergence window rather than immediately after the push. A network is a distributed system and takes time to settle; Chapter 11 treats that window as part of the gate specification.
The fourth check needs a baseline, and defining it is most of the work. It never finishes, either: every incident adds a check that later waves must not regress. Take the reading immediately before the wave starts, from the same source the gate will query afterwards, and compare after the convergence window has elapsed.
Then separate the two kinds of check, because they need different rules. Neighbor counts and interface up/down state are binary: any difference is a failure, full stop. Error counters are not. A campus access port can read zero CRC errors for an hour and then tick for reasons that have nothing to do with the change, so the gate compares a rate over the window against the same rate before it, with a tolerance set per counter class and written into the gate definition. A gate that demands zero delta on error counters will fail on noise, and a gate that fails on noise gets overridden, which is how gates die.
Where the assertions run matters as much as what they assert. Querying the Observability layer is the right default, because telemetry has already been normalized across vendors, so one gate definition covers every vendor in the fleet. Device-side test frameworks fill what Observability does not reach, which in practice means anything that needs an operational command rather than a telemetry path.
That leaves the question that decides whether a gate is worth having at all: what does it do when it gets nothing back? Absent data is a failed wave. Not a pass, not a retry, not a warning. The gate reads state through the same network interface the change just modified, so a wave that broke the management VRF on fifty switches returns exactly what a wave where telemetry has not arrived yet returns, which is nothing. If silence counts as success, the gate passes the one wave that most needs stopping, and it does so while blinding the team to what it did.
Distinguishing the two cases is mechanical. Telemetry that has not arrived yet resolves itself inside the convergence window, so the gate waits out the window before it judges. Telemetry that is never coming does not, and the gate must be able to tell the difference between a device reporting a value it does not like and a device reporting nothing at all. That means the gate asserts on device count first: every device in the wave scope has to be present in the result set before any threshold is evaluated. A result set of 46 rows for a 50-device wave is a failure with four names attached, and those four names are the most useful output the gate produces all day.
Two frameworks cover this ground. Either one lets a team encode the expected post-change state as executable assertions that live in version control next to the workflow, so the gate is reviewed like the change it guards.
- pyATS is a device test framework. Its per-platform parsers turn command output into structured data, and a comparison engine diffs the state before and after a change. The parser library is the reason to pick it: hundreds of platform and command combinations are already covered. Capobianco and Wade’s book, in this chapter’s references, covers it in depth.
- Robot Framework is a keyword-driven test framework. Its tests read as sentences, and network libraries, including NAPALM, supply the device keywords. Pick it for gates that people other than their authors have to trust.
Both frameworks are examples for explanatory purposes, not recommendations.
A minimal pyATS test asserting VLAN presence after deployment:
from pyats import aetest

class VlanValidation(aetest.Testcase):
    @aetest.test
    def verify_vlan_exists(self, device):
        output = device.parse('show vlan brief')
        assert 412 in output['vlans'], f"VLAN 412 missing on {device.name}"

    @aetest.test
    def verify_vlan_name(self, device):
        output = device.parse('show vlan brief')
assert output['vlans'][412]['name'] == 'app-payments'The same check in Robot Framework using the NAPALM library, with explicit setup and readable keyword names:
*** Settings ***
Library    Collections
Library    napalm    WITH NAME    NAPALM

*** Variables ***
@{DEVICES}    cisco-1    arista-1    hpe-1

*** Test Cases ***
VLAN 412 Is Present On All Switches After Deployment
    FOR    ${hostname}    IN    @{DEVICES}
        Connect And Check VLAN    ${hostname}    412    app-payments
    END

*** Keywords ***
Connect And Check VLAN
    [Arguments]    ${hostname}    ${vlan_id}    ${vlan_name}
    NAPALM.Open    ${hostname}
    ${vlans}=    NAPALM.Get VLANs
    Dictionary Should Contain Key    ${vlans}    ${vlan_id}
    Should Be Equal    ${vlans}[${vlan_id}][name]    ${vlan_name}
[Teardown] NAPALM.ClosePut the gates in sequence and you get the shape of a progressive rollout, which Figure 8.4 shows, including what happens when a wave fails.
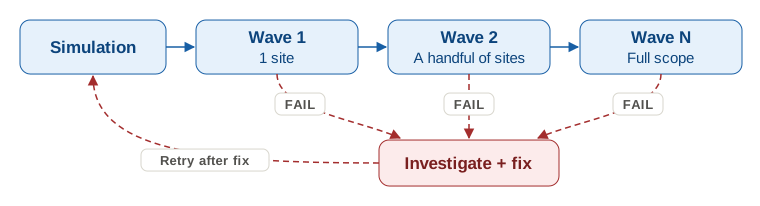
The campus VLAN rollout sequences its waves by building: simulation, then Building B alone, then two more buildings, then the remaining fleet. A team rolling the same workflow out to 100 data centers would sequence it as simulation, 1 pilot site, 2 sites, 4, 8, 16, then the rest. The shape is the same at both scales. Each wave runs the same gate against a larger scope, and when wave 4 surfaces something simulation could not catch, a hardware-specific behavior or a site-specific state, the rollout halts at wave 4 rather than at site 100.
Progressive rollout is intentionally slow. Each wave adds time: waiting for validation results, reviewing failures, deciding to proceed. For teams used to deploying everything at once, the pace feels excessive until the first wave catches a bug that would have hit all 800 switches simultaneously. Slow and sure beats fast and wrong.
Concurrency control#
Fan-out across 800 devices simultaneously will overwhelm most execution layers. Concurrency control at the orchestration level means:
- Batching: run N devices in parallel, wait for the batch to complete, then run the next N. This controls blast radius: if a bad configuration reveals a problem, you have not touched all 800 devices yet.
- Rate limiting: the execution layer has limits; the orchestrator must respect them. Do not let the orchestrator queue fill with 800 simultaneous jobs.
- Partial success thresholds: define what success means at scale. 798 of 800 devices configured correctly might be good enough to proceed; 600 of 800 should halt the workflow and escalate.
Choosing that threshold is a judgment call, and it belongs to the change rather than to the tool. Write it into the workflow definition, which passes it to the execution task. Three questions settle most cases:
- What does a device left behind actually do? A switch that missed a monitoring tag is inert; a switch that missed half an ACL is a security hole.
- Can the stragglers be fixed forward cheaply? Or does the inconsistency compound with every hour it survives?
- Is the change reversible on the devices that did take it?
A descriptive or monitoring change can run at 95% and catch the rest on the next pass. A security or forwarding change should be all or nothing, because a partially applied policy is a state nobody designed. Whatever number you pick, name what happens to the devices on the wrong side of it: left as they are and ticketed, retried on a schedule, or rolled back with the rest. A threshold without a follow-up path just moves the problem into somebody’s inbox.
Timeout and circuit breaker#
Workflows that wait forever are a reliability problem. Every step that can block needs a configured timeout. When the timeout expires, the workflow needs a defined action: escalate, skip, or abort.
The Circuit Breaker pattern extends this to repeated failures: if a step fails more than N times in a window, stop trying and raise an alert. This prevents a single unreachable device from holding a workflow open for hours.
Resilience across block boundaries#
The patterns above address failures within the Orchestrator’s own execution: durable state, retries, rollback, wave gates, concurrency, timeouts. But workflows also fail at the boundaries between blocks, and those failures require different handling.
When the Orchestrator calls the SoT API and receives a timeout, the appropriate response is different from when the Executor returns a device failure. A SoT timeout means the Orchestrator cannot verify that the intent it is about to deploy is current. Proceeding with cached data risks applying stale configuration. The correct response is usually to abort and retry rather than to proceed with uncertainty. A Presentation layer event that never arrives, such as an approval webhook, may mean the request was rejected, the integration is broken, or the message was lost. These require different recovery paths: a missing approval is not a transient failure that should be retried indefinitely.
Block-boundary failures should be classified explicitly in the workflow definition:
- Dependency unavailable (SoT, Observability): the workflow cannot proceed safely. Fail cleanly, emit a diagnostic event, and do not retry with stale data.
- Dependency degraded (partial SoT read, Observability lagging): the workflow may proceed with explicit acknowledgement that it is operating with reduced confidence. Log the degraded state; do not silently proceed.
- Downstream block failed (Executor returned error, Collector returned no data): apply the retry and rollback patterns above, but classify the failure source accurately so the alert and audit record name the correct block.
A workflow that treats all failures as retryable device errors will retry a broken SoT integration until it exhausts its retry budget and pages an on-call engineer with the wrong diagnosis. Classifying failures at block boundaries is the difference between a workflow that fails fast and one that fails confusingly.
Classifying failures is only useful if somebody can see them afterwards, which is the next functionality.
Traceability#
When something goes wrong at 3am, two questions need immediate answers: what is the current state of the workflow, and who triggered it?
When the audit team asks questions three months later, the same record must answer: what ran, which version of the workflow definition ran, what every step received as input, what it produced as output, and what the final outcome was.
These are different questions with different urgency, but they come from the same source: the workflow state and its audit record.
Traceability is a cross-cutting concern across the automation platform: the Source of Truth records every change to intent; Observability records every change to network state. But neither of those records tells you who initiated a workflow, which steps ran in sequence, and what caused the outcome. Only the Orchestrator’s audit record closes that gap. Because the Orchestrator coordinates all the other blocks, its trace is the authoritative view of everything that happened across the full automation system for a given event.
State is not network state. This distinction is easy to miss. In Chapter 7, “state” meant the network’s operational state: interface counters, BGP sessions, device CPU. In Chapter 4, “state” meant the desired state held in the SoT. In Chapter 6, “execution state” meant the progress of one task: which devices took the change and which failed. Here, state means workflow state: which steps of the whole run have finished, which are running, which failed, and what each produced. The Executor tracks devices inside a step; the Orchestrator tracks the steps.
The two are related (a workflow step produces network state changes that Observability then validates) but they are stored differently, queried differently, and serve different purposes. Do not conflate them.
Every workflow run moves through a defined workflow state machine, shown in Figure 8.5:
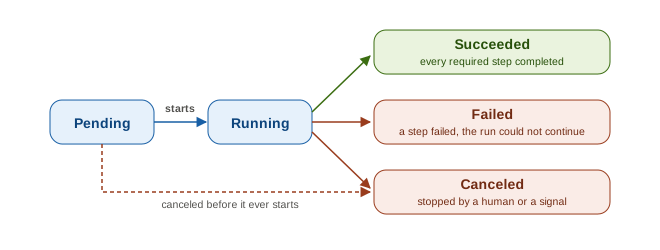
- Pending: received but not yet started
- Running: actively executing steps
- Succeeded: all required steps completed successfully
- Failed: a step failed and the workflow could not continue
- Canceled: stopped by a human or an external signal
Each step within the workflow carries its own state. A partially successful fan-out run must show exactly which devices succeeded, which failed, and which were skipped. “The workflow failed” is not useful without the per-device breakdown.
For audit log purposes, every workflow run record must contain, at minimum:
- Who or what triggered the run: human identity, system name, triggering event ID
- When it started and when it completed
- Which version of the workflow definition ran
- The full input the workflow received
- The output of every step
- The final outcome
This record must be tamper-evident: it cannot be edited after the fact. In regulated environments, the Orchestrator’s audit log is the change management record. If this record can be altered, the change management system is not trustworthy (more about it in Chapter 13).
Operating under change control
Being the change record puts the approval gate under rules the tool knows nothing about. Three of them show up in almost every change policy.
Who may approve. Separation of duties usually means the approver cannot be the person who triggered the run, and often cannot be the person who wrote the workflow. The Orchestrator holds both identities, so it can enforce that rather than leaving it to etiquette.
What a timeout means. An approval gate that proceeds automatically when nobody answers is convenient, and in a regulated environment indefensible: a change nobody approved reached production. Make the timeout action explicit per workflow, with three choices rather than a default, proceed, abort, or escalate to a second approver, and record which one fired. “Approved by timeout” has to be visible in the record, not inferred from its absence.
What bypasses the workflow. There will be nights when somebody configures a device by hand. The Break-Glass Procedure path belongs to Chapter 13; what matters here is that the Orchestrator records the bypass as an event, so the trail shows the gap instead of silently missing it.
Most orchestration tools write audit logs to a database they also own. This may be sufficient, depending on your compliance requirements. Some organizations export orchestration audit logs to an append-only external system (a SIEM, a write-once log store) to prevent tampering by anyone with database access, including anyone who can run queries against the orchestrator’s own database.
All of that assumes the workflow definition itself is sound. Keeping it that way is production software work.
Pipeline Management#
A workflow that configures 800 production switches is, architecturally, production software. The challenge is how you store, validate, and promote workflow definitions so that the logic itself is as reliable as the infrastructure it manages.
The workflow definition encodes decisions: which pre-checks to run, what to do when a device is unreachable, what constitutes success. Changing it carelessly changes what happens to every device that workflow touches next time it runs.
I have seen teams silently break production workflows by editing the workflow definition directly in the orchestration tool’s UI. Nobody noticed until the next run touched a device type the modified step did not handle correctly. The UI edit had no review, no test, no rollback path.
Git-backed definitions store workflow definitions in version control. The orchestration tool pulls from Git on deployment, not from local UI edits. This gives you a history, a review process, and the ability to roll back to any prior version.
There are two common ways to promote pipeline changes:
Blue/green pipeline versions: Maintain two versions of a workflow in production: the current stable version that handles all active workflows, and a new version that receives new runs after a validation period. Traffic shifts only when the new version is proven stable.
Canary rollout: A new workflow version handles a small number of runs first. A firmware upgrade workflow might apply the new version to 10 devices before promoting it to the full fleet. Problems surface at 10 devices, not 800.
Either strategy combines with testing the definition before it reaches production:
- Dry-run mode: run the workflow against real inputs but skip the steps that modify the network. Verify that the logic produces the expected sequence of actions.
- Staging environment: a subset of devices dedicated to testing workflow changes before they run against production.
- Shadow execution: run the new version in parallel with the current version, but ignore its results. Compare outputs to detect divergence before cutting over.
Two different rollbacks: Rolling back a workflow run means undoing the network changes made by a specific execution (handled by the Saga Pattern in the Resilience and Scale section). Rolling back a workflow definition means reverting the workflow logic to a previous version: switch the Git reference, redeploy the definition, and the next run uses the prior version. These are orthogonal operations. Confusing them is how teams end up rolling back the wrong thing.
Every functionality above assumes a workflow somebody defined in advance. One model does not.
Agentic Orchestration#
The agentic coordination approach introduced in the Workflow Engine section works differently: instead of following a pre-defined DAG, an AI agent backed by Large Language Model (LLM)s receives a goal and determines the sequence of actions at runtime. The agent observes current state from the Observability and SoT blocks, reasons about what action closes the gap, invokes the Executor, and re-observes to verify the outcome. If the result is not what was expected, it reasons again. The decision logic is not encoded in a workflow definition; it lives in the model’s reasoning.
What enables this across the full automation platform is an interface such as Model Context Protocol (MCP). Each building block exposes an MCP server: a defined set of tools the agent can call as part of its reasoning loop. The SoT server exposes device queries and intent lookups; the Observability server exposes state queries and compliance checks; the Executor server exposes job triggering and status polling. The agent calls these tools in whatever sequence the situation requires, without the workflow author having pre-coded every possible combination (but providing guardrails).
The architectural implication is that the blocks do not need to know about each other or about the agent. The MCP interface is the contract. The same SoT that answers REST calls from a DAG-based workflow today will answer MCP tool calls from an AI agent without modification. Clean block boundaries pay off here in a way that tight coupling never would.
DAG-based workflows and agentic orchestration are not mutually exclusive. In practice, DAG-based workflows are the right choice for routine, well-defined operations: VLAN deployments, compliance scans, firmware upgrades. These are high-frequency, need predictable audit trails, and should not depend on LLM reasoning. The agentic layer handles the novel: incident-driven remediation, anomaly investigation, situations where the right sequence of actions cannot be determined until the current state is understood. The two approaches can coexist in the same platform, with the DAG routing to an agentic workflow when a situation does not match any known pattern.
This section introduces the pattern. The full architectural treatment, including how agentic orchestration scales to continuous autonomous operation across the full network, is in Chapter 18.
Those five functionalities, and the agentic variant, describe what an Orchestrator has to do. The tools that do it make very different bets about how.
Solutions Landscape#
The orchestration tool market covers a wide range of models, from network-specific platforms to general-purpose workflow engines. The question is rarely “which is best” and almost always “which fits how we operate.”
| Tool | Execution model | What makes it architecturally different | Network automation fit |
|---|---|---|---|
| AWX / Ansible AAP | YAML workflow templates, UI-first | The orchestrator and executor are the same system: Ansible jobs are first-class citizens, no translation layer. RBAC, credentials, and inventory are unified. | Teams already using Ansible for execution; the straightforward path when Ansible is already the execution layer |
| Itential | Low-code/no-code visual builder, network-specific | Purpose-built for network operations: pre-built adapters for ITSM, IPAM, and multi-vendor devices. Workflow builder accessible to non-developers. | Enterprise network teams who need multi-vendor, multi-system integration without custom code |
| Prefect | Python code-as-DAG, developer-first | Workflows are Python functions with decorators. The pipeline is software: tested, versioned, and observed like application code. Strong native observability of the pipeline itself. | Teams comfortable with Python who want to treat orchestration with software engineering discipline |
| Temporal | Durable execution engine, code-defined | Survives crashes mid-workflow: any step replays from its last checkpoint. Saga and compensation are first-class constructs, not bolt-ons. | Long-running workflows (firmware upgrades, large rollouts) where partial execution and rollback must be rock-solid |
| Windmill | Script-first, lightweight, open-source | Each node in the workflow is an independent script (any language). Low operational overhead; easy to self-host and customize without enterprise platform complexity. | Smaller teams or orgs that want flexible custom logic without platform weight |
The tools listed here are examples for explanatory purposes, not recommendations. Each has a different architecture and trade-off profile. Evaluate them against your team’s capabilities, existing tooling, and operational constraints.
One architectural question cuts across all of these: does your orchestration tool also serve as your execution engine, or are they separate? AWX/AAP collapses both into one. Prefect, Temporal, and Windmill are orchestrators that call out to separate execution tools (Ansible, custom scripts, APIs). The collapsed model is simpler to operate; the separated model gives you more flexibility to swap execution engines independently. Chapter 3 introduced this trade-off under minimal coupling.
The AWX/AAP row in the table above deserves a clarifying note for teams considering it as their primary platform. AWX workflow templates are the Orchestrator; individual Ansible job templates are the Executor. The architectural boundary between the two exists even though they run within the same platform. A team that puts all logic into job templates (the Executor) and uses workflow templates only to chain them has effectively built an Orchestrator from execution primitives, which limits visibility, retry configuration, and rollback options. Conversely, a team that puts business logic into workflow templates (conditional branching based on external data, dynamic inventory selection) is using AWX as a genuine orchestrator. The distinction matters because AWX’s audit trail, approval gates, and notification hooks are workflow-level features. If all your logic lives in job templates, you cannot use those features without restructuring. This is not a limitation of AWX; it is a consequence of not distinguishing Orchestration from Execution in the design.
These tools overlap significantly: Python runs in both Prefect and Windmill; both Prefect and Temporal can call Ansible. A rough starting point: if your team is Ansible-first and wants minimal new components, AWX workflow templates are the natural fit; if you want testable, code-first pipelines with software engineering discipline, Prefect and Windmill both work with different operational models; if durability under partial failure is the primary constraint, Temporal’s replay model is purpose-built for it. Treat this as a foothold for evaluation, not a final answer.
Enough theory. Here is the whole block working on one service, on the campus network Part 2 has been following.
Implementation Example#
The campus example has reached this chapter in pieces. The intent was modeled and stored (Chapter 4 and Chapter 5): the VLAN ID, subnet, target switches, and the templates that render it. In Chapter 6, the Executor pushed that configuration to the campus switches. In Chapter 7, we validated the deployment and began monitoring the service.
What we never addressed is who coordinates all of that. Each chapter had an implicit assumption: an engineer ran each step manually. Here we make that explicit and replace the engineer with a workflow.
Scenario: The application team has submitted a request for a new application segment: VLAN app-payments, prefix 10.12.4.0/24, deployed to the access and distribution switches in Building B across all three of the campus platforms. The request came through an ITSM portal and has just received final approval. That approval fires a webhook, the Orchestrator receives it, and the VLAN service deployment workflow starts.
Requirements:
- Validate that the intent in the Source of Truth is complete before anything touches a device
- Pre-check every target switch in parallel, and stop if too many fail
- Hold for human approval, with a defined timeout and a recorded decision
- Deploy through the Executor rather than configuring devices directly
- Validate the result through Observability, per device, not per job exit code
- Roll back only the devices that failed, and report the outcome where the request came from
Blocks involved:
- Source of Truth: holds the VLAN service definition and the device records the workflow validates against
- Execution: applies the configuration, once the Orchestrator decides it is time
- Observability: supplies the per-device validation that decides success from partial failure
- Presentation: carries the request in and the outcome back out, through the ITSM portal
- Orchestration:
- Workflow Engine: a six-step DAG with branching on every result
- Triggering: an event-driven start from an approval webhook, running asynchronously
- Resilience and Scale: fan-out across the fleet, and a failure threshold: below it the Executor restores the failed devices, above it the Saga compensates the whole step
- Traceability: one audit record per run, carrying who approved, what ran, and what each step produced
- Pipeline Management: the workflow definition itself lives in version control, not in the tool’s UI
This example names no products on purpose. Any of the tools from the Solutions Landscape section can play each role, and what transfers is the shape of the workflow rather than the brand on each box. The device platforms stay generic for the same reason, as they do across Part 2: what matters is that there are three of them.
Implementation Flow#
The workflow runs six steps, from validating the intent to routing the outcome. Figure 8.6 shows the whole path, including the three ways it can end; the list below walks through each step.
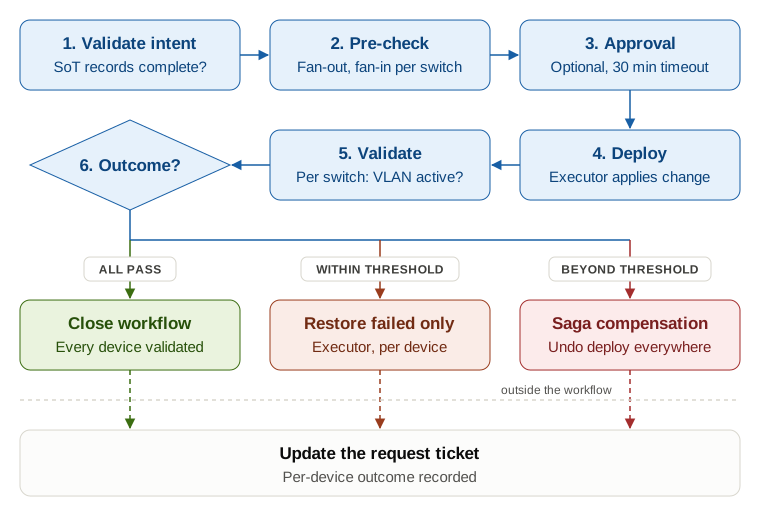
Validate the intent. The Orchestrator queries the Source of Truth to confirm that device records and the VLAN definition are complete before anything touches the network. This is not the structural validation the SoT already ran when the data was written. It checks that everything this workflow needs is present, such as a management address on every target switch. This guard step is the Orchestrator’s responsibility, not the Executor’s: the Executor should receive valid input, not discover bad data mid-push. If any check fails, the workflow aborts and updates the request ticket with the specific gap. (How SoT validation is structured is covered in Chapter 4.)
Pre-check, in parallel. The workflow fans out across all target switches in parallel. Each branch runs a lightweight pre-check: reachability, VLAN table state, available capacity. The fan-in step classifies results and branches; the failure threshold is configurable. What matters orchestration-wise is that this is a fan-out/fan-in pattern with conditional branching, not sequential polling. (Pre-check execution patterns are in Chapter 6.)
Hold for approval. An optional human sign-off before the production push. An engineer has 30 minutes to approve or reject, and the configured timeout action for this workflow is to escalate to a second approver rather than to proceed, which is recorded either way. The Orchestrator holds the workflow in a waiting state with an external dependency until the approval arrives or the window expires.
The approval gate is a policy decision, not an architectural one. High-maturity teams often remove it and replace human approval with automated confidence thresholds derived from pre-check results: if pre-check coverage exceeds 95% and zero critical failures were found, proceed automatically. Teams still building trust keep the gate. Both choices are valid at different points on the automation maturity spectrum discussed in Chapter 1.
Deploy. The Orchestrator triggers the Executor’s job template from Chapter 6, passes the parameters from the SoT validation step, and waits for the result. The Executor handles the rest. This is the separation of concerns in practice: the Orchestrator decides to act, the Executor acts.
Validate, in parallel. After deployment, a second fan-out runs a validation job per target switch: does the VLAN appear in the VLAN table, are interfaces in the expected state? The fan-in classifies results: full success, partial success, or failure. (What the Observability layer validates and how is covered in Chapter 7.)
Route the outcome. Full success closes the workflow: the request ticket is updated and a summary posted to the team channel. Partial failure within the change’s threshold does not trigger Saga compensation: the Orchestrator has the Executor restore only the devices that failed validation, and the devices that succeeded keep their configuration. Failure beyond the threshold does trigger it, and the Saga undoes the deploy step on every device that took the change. The request ticket records the per-device outcome.
Solution Summary#
This workflow shows all seven building blocks from the NAF framework in Chapter 3 working together: the Source of Truth provided the intent, the Executor applied it, Observability validated the result, the Orchestrator coordinated the full sequence, and the service portal’s webhook (Presentation, covered in Chapter 9) triggered the entire flow from the application team’s request.
The engineer from the opening story is still here. She is the one who reviews the approval gate when it fires. She is the one who investigates the partial failure the Saga Pattern flagged but could not fully resolve. She is still the expert. What the orchestrator took from her is not the expertise, but the burden of holding the sequence together in her head, re-running it step by step, and being the only person who could. That is what coordination without automation actually costs.
Summary#
This chapter established that the Orchestrator is the building block that transforms a set of working automation tools into a system that behaves as one. Without it, coordination remains manual, failures require human intervention, and the scale of the network becomes a limit on how much automation is actually possible.
At its core, orchestration rests on a workflow engine that defines how multi-step processes are structured and executed. The choice between monolith, DAG, choreography, and agentic coordination is an architectural decision, not a tooling preference. The DAG model with its named patterns (sequential, fan-out, Saga, with conditional branching across all three) is the production standard for network automation. The agentic pattern, introduced in the Agentic Orchestration section with MCP as the interface layer, represents a different trade-off and receives its full treatment in Chapter 18.
Triggering defines how the external world reaches the orchestrator. The distinction between execution-layer triggering (Chapter 6) and orchestration-layer triggering matters architecturally: one drives a single device change, the other drives a coordinated multi-system workflow. Event-driven automation and the Closed-Loop Pattern inherit the non-negotiable properties of idempotency and deduplication precisely because automated triggers fire without human review.
Resilience and scale separate automation that works in demos from automation that works at 3am. Durable state, retry strategies that distinguish transient from permanent failures, the Saga Pattern for partial-failure compensation, health gates that decide whether each wave of a rollout may proceed, and concurrency controls for large device populations are not optional features to add later. They define whether the orchestrator can be trusted when conditions are not ideal.
Traceability provides the record of what ran, who triggered it, and what every step produced. This record is distinct from network operational state (Chapter 7) and network intent (Chapter 4). Tamper-evident audit logs are a compliance requirement, not an afterthought. Pipeline management closes the loop: workflow definitions are production software and must be versioned, tested, and promoted with the same discipline as any other code running in the automation platform.
The campus VLAN service scenario brought these five functionalities together: a six-step workflow triggered by an approval webhook, coordinating SoT validation, pre-checks, execution, Observability validation, and Saga compensation, with no engineer in the coordination loop. The natural next question is who sees this workflow running and how the application team that triggered it tracks its progress. That is the Presentation layer, covered in Chapter 9.
References#
- Building Microservices, 2nd Edition, Sam Newman (O’Reilly, 2021). Orchestration versus choreography, saga-based coordination, and the trade-offs between the workflow-engine models in the Workflow Engine section.
- Enterprise Integration Patterns, Gregor Hohpe and Bobby Woolf (Addison-Wesley, 2003). The canonical catalog of messaging and workflow patterns; the foundation for the triggering and pipeline patterns in the Triggering and Pipeline Management sections.
- Designing Data-Intensive Applications, Martin Kleppmann (O’Reilly, 2017). Event-driven coordination, durable state, and exactly-once processing; the grounding for the state, traceability, and deduplication requirements in the Traceability section.
- Release It!, 2nd Edition, Michael T. Nygard (Pragmatic Bookshelf, 2018). Retries, timeouts, circuit breakers, and stability patterns; the source for the resilience-and-scale properties in the Resilience and Scale section.
- Cisco pyATS: Network Test and Automation Solution, John Capobianco and Dan Wade (Cisco Press, 2024). A comprehensive guide to pyATS and Genie for network test automation: parsers, structured state validation, and CI/CD pipeline integration.
💬 Found something to improve? Send feedback for this chapter