Execution#
The playbook had been running perfectly for months: ten access switches in the lab, two minutes end to end, clean results every time. When the team decided to roll it out to the full inventory of 800 switches, nobody expected trouble. The first 600 devices updated without issue. Then the job slowed. Then it stalled. The RADIUS server, suddenly receiving 150 simultaneous SSH authentication requests, started rejecting connections. Ansible hung on 150 devices mid-execution. An engineer killed the job.
What came next was the harder problem: nobody knew which 600 devices had been updated and which 150 hadn’t. No execution state had been recorded. They re-ran the playbook and hoped idempotency would save them. It did, that time. But the incident revealed something important: the execution layer had been designed for the lab, not for the network. Speed, parallelism, error boundaries, state tracking, none of it had been considered. The automation worked; the execution architecture didn’t.
Most people think of network automation as: “take the same data, and without connecting as a human in the CLI, do something on the network”. I would bet most people starting with network automation begin there. And yes, that is what the Execution block does. But as you’ve seen throughout this book, network automation is bigger than this first step, and Execution is just one component within the architecture.
The Execution block directly interacts with the network for the most dangerous operations (e.g., config changes or reboots). So don’t skip this chapter; it’s crucial to do it right.
In this chapter, I’ll cover the goals and functionalities this block encompasses, and the internal capabilities it needs to achieve them.
Fundamentals#
Execution defines how actions reach the network. The what comes from the Intent block, and the when comes from Orchestration.
In early network automation projects, a script that bounces an interface for a given device and interface name can be the first win. What starts as that one script grows into a much more sophisticated system.
What does an execution system actually need to do? Five things matter:
Get the right data into place. Before executing anything, you need to know what to execute (the intent), where to execute it (which devices), and how to access them (credentials, connection details). This means pulling inventory and fetching the intended state from the Source of Truth (more about it in Chapter 4), and sometimes querying observability data to understand current conditions. Without this integration, your execution engine is just blindly running commands. For your mental health, avoid it.
Start when needed, whether that’s now or later. Sometimes you need immediate execution: an engineer clicks “deploy” and expects it to happen right away. Other times, execution should wait: deploy during the maintenance window, wait for a device to come online, or react to an event from observability. The system needs to support both synchronous and asynchronous triggers.
Track state over time. Network-wide operations aren’t instant. You might deploy to hundreds of devices over hours. Which devices succeeded? Which failed? Which are still pending? State management also enables idempotency (run the same task twice, get the same result), rollback (undo what you just did), and resume (pick up where you left off after a failure). Without state tracking, every execution is a one-shot gamble.
Execute reliably at scale. A script that works for 5 devices often breaks (or degrades) at 500. You may need parallel execution, error handling, retries, rate limiting, and dry-run capabilities. The system should gracefully handle partial failures, provide clear feedback on what went wrong, and never leave the network in an undefined state. Different operations need different strategies. Some are fast and parallel, others slow and serial.
Work with any network device or platform. Your network probably has Cisco, Arista, HPE, AWS, Azure, Linux boxes, Palo Alto, Fortinet, etc. Each one speaks different protocols and has different operational patterns. Your execution layer needs adapters for all of them, establishing a common interface so the rest of your automation doesn’t care about the differences.
The execution block sits between planning and action. It receives instructions from Intent (what should be configured) and Orchestration (when and how to do it), then interacts directly with network devices to make changes happen.
What’s in scope
- Connecting to network devices via any supported protocol
- Executing configuration changes, operational commands, file transfers, reboots
- Managing execution state and tracking progress
- Handling errors, retries, and rollbacks
- Providing feedback to Orchestration
What’s out of scope
- Deciding what to configure (that’s Intent)
- Orchestrating complex multi-step workflows and deciding when to trigger (that’s Orchestration)
- Long-term storage and analysis of execution results (that’s Observability)
Think of execution as the engine in a car: it provides power and motion, but doesn’t decide where to go or when to turn. Those decisions come from the driver (Orchestration) following a map (Intent).
Next, let’s discover which functionalities this block has to provide to answer the previous goals.
Functionalities#
Five functionalities work together to modify network state safely and reliably, and Figure 6.1 maps each one to the goal it delivers.
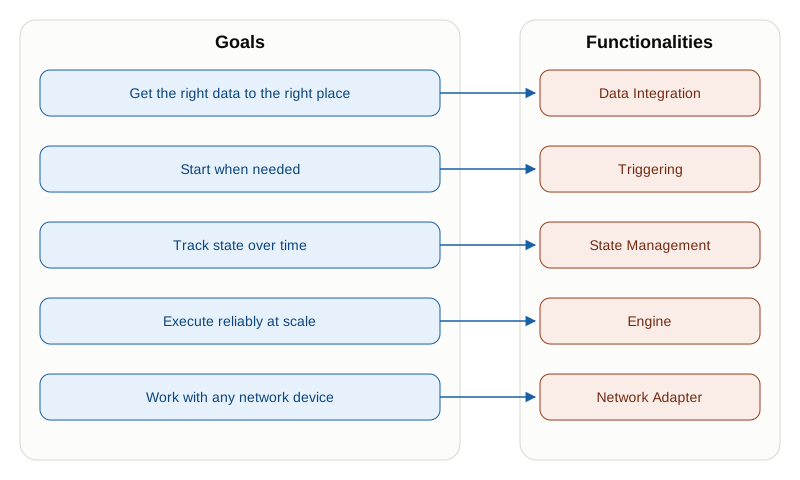
- Data Integration. Gets the intent, the inventory, and the credentials into place before anything runs, from the Source of Truth, from observability, and from the secrets backend.
- Triggering. Starts execution, synchronously when someone is waiting for the answer and asynchronously when something else is.
- State Management. Tracks where the execution is and what the devices look like, which is what makes idempotency, resume, and rollback possible.
- Engine. Runs the task: how the logic is expressed, how much of it happens at once, where it runs from, and what happens when part of it fails.
- Network Adapter. Speaks the protocols, and manages the connections underneath them, so nothing above this layer knows which interface a device speaks.
These components form a pipeline: data integration provides the inputs, triggering starts the process, the engine executes tasks using network adapters, and state management tracks everything throughout.
Following this order, let’s start with the data integrations this block requires.
Data Integration#
There are many different integrations, but the cornerstone is the integration with the Source of Truth, to understand what to do and where to do it.
And, from all the intent data, everything starts with the Inventory. The inventory data defines the target devices. We covered this in Chapter 4, but at minimum, you need:
- Target: IP address or FQDN to reach the device, or an identifier plus account for a cloud service
- Platform/OS: Device/service type, vendor or provider, version (determines which protocol and configuration artifact syntax to use)
- Credentials: Username/password, Secure Shell (SSH) keys, Application Programming Interface (API) tokens, certificate paths
- Connection parameters: SSH port, timeout values, API endpoints
That is the minimum. You can also pull more of the technical layer from the Source of Truth to refine how a job behaves. For example, the location, the role (spine/leaf/edge), or the environment (prod/staging) can change how the Executor runs its logic.
The inventory data always comes from the Intent block, even though in many cases this boundary is not so clear. For example, Ansible, a very popular Executor solution, leverages YAML files (host_vars, group_vars). These files belong to the Source of Truth block. As mentioned before, one tool can implement many functions, and one function can be implemented by many tools.
Inventory never carries credentials, only pointers to them. The Source of Truth says which secret a device uses; the Executor resolves that pointer at job start and keeps the value no longer than the job. The Executor should support multiple credential sources and per-device overrides, because one fleet rarely shares one account. The security consequences of getting this wrong come later in this chapter.
Finally, the meat and potatoes of the Source of Truth integration is the actual intent, what you want to configure or change:
- Configuration artifacts: Ready-to-deploy artifacts that can be structured data used directly with APIs, or a set of CLI commands that build the configuration.
- Technical-layer data: the vendor-agnostic intent itself, for a platform module that translates it into the device’s syntax at execution time.
- Commands: Specific Command Line Interface (CLI) commands or API calls to execute for device operations.
- Files: Software images for upgrades, configuration files for import.
Which of the first two you receive depends on where the component layer’s code runs. Chapter 4 names the two options: Render in the Source of Truth hands the Executor a finished artifact, and Translate in the Executor hands it technical-layer data and lets a module do the translation. Either way, the content is the Intent block’s, exposed per inventory item in scope.
Should the Executor fetch intent data itself, or should the caller (e.g., Orchestration) pass it in? Both work. Fetching intent directly couples execution to your Source of Truth but ensures data is always fresh. Receiving intent as parameters makes execution more generic but requires Orchestration to handle data fetching.
Configuration artifacts can go stale between the moment they are generated and the moment the Executor consumes them. If the Source of Truth (SoT) data changes after a pre-generated artifact was cached, the Executor may apply an outdated configuration. The staleness window is the time between the last SoT commit and the execution trigger. For automation that fetches artifacts at trigger time (rather than from a cache), this window is minimal. For pipelines that pre-render artifacts on a schedule and store them for later use, the window can grow to hours. Where data freshness matters, the Orchestrator or Execution trigger should always pull a fresh artifact from the SoT rather than from a cached file.
Comparing desired and actual state is Observability’s analysis, and deciding what to do about the result is the Orchestrator’s. The Executor’s own comparison is narrower: the real-time dry-run diff for the change it is about to make. But when there is a delay between the decision and the execution, the Executor may need to check actual data at the last instant before proceeding, for example:
- Pre-execution validation: Is the device reachable? Is there enough disk space for an upgrade? Are there active sessions that would be disrupted?
- Graceful degradation: Before rebooting a switch, query observability to see if there’s redundant connectivity. If not, delay or abort.
- Conditional logic: Only apply a configuration if certain conditions are met (CPU below threshold, no active alarms, time-of-day within window)
- Drain capacity: Before executing a draining operation, ensure the available capacity is enough to absorb the change without breaking SLOs.
A common pattern: tools like Ansible’s “network health checks” modules or Nornir’s data-gathering tasks run observability queries before and after execution, comparing results to detect unexpected changes. The “before/after snapshot” approach catches regressions that would otherwise go unnoticed. Again, the same tool acting as Executor could act as Collector, but even then the responsibilities stay split.
When to run the Executor is the next question. When does the Executor change the network state? Maybe because of a change in the Source of Truth, maybe there is a self-healing action to implement, or maybe someone is running a demo that needs to simulate an interface going down. One way or another, something has to kick off the Executor.
Triggering#
Execution doesn’t start by itself. Something has to trigger it. There are two main patterns:
Synchronous (immediate, blocking):
- API calls: An external system or user invokes an API endpoint, execution runs, and the response includes results. Simple and direct.
- Webhooks: External systems (Git, ticketing, CI/CD) send HTTP requests when events happen. Common pattern: Git push triggers config deployment.
- The Presentation layer via CLI commands or API calls: Engineers run commands that directly invoke execution (
ansible-playbook,terraform apply, custom scripts). These CLI commands are part of the lightweight presentation layer offered by these tools (more in Chapter 9).
Asynchronous (delayed or event-driven):
- Event listeners: React to events from observability (device down, threshold crossed), message queues, or external systems. Ansible Event-Driven Automation (EDA) built this pattern explicitly: listen to events, match rules, trigger playbooks automatically.
- Message queues: Tasks submitted to a queue (RabbitMQ, Kafka, AWS SQS), workers pull and execute them. Enables buffering, priority queuing, and rate limiting.
The right approach depends on your use case. Immediate changes (fixing a production issue) need synchronous triggers. Reactive automation (responding to alerts) uses event listeners. Scale considerations matter too, as we’ll cover in Chapter 12.
The actual trigger usually comes from Orchestration, though if that doesn’t exist, other blocks can trigger execution directly. For example, triggering directly from the Presentation layer as a human-exposed task, or from the Source of Truth block.
Execution can be a single targeted task, but it can also involve multiple parallel targets belonging to the same task, and that needs state coordination.
State Management#
State management is about tracking where you are in an execution and what the world looks like so you can make intelligent decisions.
There are different types of state data to track:
- Which devices have been processed?
- Which tasks succeeded, failed, or are pending?
- If a task failed with a transient error, can we retry?
- If execution was interrupted, can we resume where we left off?
- What is currently configured on the infrastructure?
Most of these questions are answered within a single execution, but the last one, which belongs to the Observability block even though it is commonly implemented here, can be approached in two ways:
Stateless (e.g., Ansible). Each execution runs independently. No persistent state between runs. Every execution starts fresh: gather current state, compute diff, apply changes. Simpler to operate (no state database), but less efficient (you re-discover everything each time) and no built-in rollback.
Stateful (e.g., Terraform). The system maintains a persistent state file tracking what was last deployed. On each run, compare desired state (your config) to recorded state (what you deployed last time) to actual state (what’s on the device). This enables precise change planning, efficient execution (only change what’s different), and rollback (revert to previous state). But now you have a state file to protect, lock, and sync across multiple operators.
Stateful tracking looks ideal, but it only holds if every change goes through the tool. One engineer fixing something by hand at 2am makes the state file a lie, and from then on you are importing and re-syncing resources instead of deploying them. That is why Terraform works well for cloud, where the API is the only way in, and poorly for switches, where the console is always there.
Transactional execution is the next step when you want stronger safety guarantees than best effort. A transaction groups multiple device changes into a single unit: either everything is applied and validated, or the system rolls back to the previous state. This requires three things:
- A clear boundary (what operations are inside the transaction)
- A durable record of pre-change state (for rollback)
- A locking or lease mechanism to prevent concurrent changes from breaking atomicity
In practice, most network automation uses “transaction-like” behavior rather than strict ACID semantics (atomic, consistent, isolated, durable: the guarantees a database gives a transaction), because not all devices support native commit/rollback. Still, you can approximate transactions by taking snapshots, using candidate configs (when supported), enforcing exclusive locks, and making rollback paths a first-class part of the execution flow.
The challenge? State sync and sharing. If multiple people or systems modify network devices, state gets stale. Terraform addresses this with remote state storage and locking. Ansible avoids the problem by being stateless but sacrifices efficiency. The middle ground: cache current state temporarily, validate before each operation, and build “eventual consistency” patterns where brief mismatches are acceptable.
As mentioned in the design principles, idempotency is key to creating trust in your network automation system, and idempotency happens, mostly, here in the Executor.
Idempotency means running the same automation multiple times produces the same result. Apply a VLAN config once: VLAN is created. Apply it again: nothing changes (VLAN already exists). This is critical for reliability: if execution fails halfway through, you can safely re-run it without creating duplicates or breaking things.
How tools achieve idempotency:
Built-in modules (e.g., Ansible): Most Ansible modules are idempotent by design. The
cisco.ios.ios_vlansmodule checks if the VLAN exists before creating it. If it’s already there with correct config, Ansible reports “ok” (no change). This requires the module author to implement checking logic.State comparison (e.g., Terraform): Terraform compares desired state to current state, computes a diff, and only applies differences. If you run
terraform applytwice with no changes to your config, the second run does nothing.Declarative APIs (e.g., NETCONF/YANG): Some protocols handle idempotency natively. NETCONF’s
<edit-config>withmergeoperation is inherently idempotent: it merges your config with existing config, creating or updating as needed.Manual checking (e.g., raw scripts): If you’re writing Python or Go scripts, you implement idempotency yourself: query current state, compare to desired state, only make changes if there’s a diff.
Idempotency is harder than it looks. What if the VLAN exists but has wrong settings? Should you update it (potentially disrupting traffic) or report a conflict? What about transient failures (device temporarily unreachable)? Retry logic must distinguish between “operation already done” (idempotent success) and “operation failed” (real error).
Idempotency has a cost, and the overhead depends on who does the comparison. With NETCONF merge or a declarative resource module, the device reconciles state itself, so the extra round trip costs you nothing. With raw scripts, you pay for every check: one read per device before every write. That is the hidden reason declarative tooling scales better. It is not smarter, the comparison simply happens where the state already lives.
Finally, the Engine determines which logic is supported and how it can be defined.
Engine#
The execution engine is the core logic that takes a task (“configure this VLAN on these 50 switches”) and executes it safely and efficiently. This is not Orchestration. The Orchestration block coordinates multiple execution tasks across time and dependencies. The engine just runs one task well (or a simple chain of tasks).
It accepts a task definition, breaks it into per-device operations, runs them with the right concurrency, handles the failures, and reports what happened. That breaks down into six design questions, which are the rest of this section: how you express the logic, how much runs at once, where it runs from, what you can see before committing, how you confirm the result, and what happens when part of it fails.
An execution engine might configure 100 routers in parallel, but it doesn’t decide when to configure them, which configs to apply based on business logic, or what to do next based on results. Those are Orchestration concerns. Execution is the workhorse; Orchestration is the foreman.
That said, execution engines often support simple chaining: “do task A, then task B on the same devices”. That’s basic sequencing, not full Orchestration. When you need complex workflows (wait for external approval, branch based on results, coordinate across multiple systems) you need a real Orchestration layer (more in Chapter 8). For example, this sequence can still be one execution flow: upgrade firmware, wait for a device reboot, verify operation, update inventory. But if it requires human validation or conditional branching based on broader validation, it belongs in the Orchestration block.
The first thing the Engine defines is how you express the execution logic. Different language styles have different tradeoffs:
| Style | Examples | Strengths | Tradeoffs |
|---|---|---|---|
| Domain-specific languages (DSLs) | Ansible (YAML), Terraform (HCL) | Lower barrier to entry, self-documenting intent, built-in execution semantics | Limited flexibility, harder debugging in complex scenarios, conditional logic can become awkward |
| General-purpose programming | Nornir (Python), custom Python/Go scripts | Full flexibility, strong debugging tooling, easy library reuse | Higher skill requirement, more code to maintain, less standardization across teams |
Many teams use DSLs (Ansible) for common patterns and drop into custom code (Python modules, plugins) for complex edge cases. This balances accessibility with power. The human factor usually decides which approach wins, more on that in Chapter 14.
Regardless of the language, there are two basic patterns for defining actions.
Imperative versus Declarative#
As already defined in Chapter 2, there are two patterns to define actions:
Imperative: You specify how to do something, step by step.
Declarative: You specify what the end state should be, and the tool figures out how.
Declarative is simpler for the person writing the task, and it is the shortest path to idempotency. But there is no hidden magic: the work does not disappear, it moves. Someone has to write the module that reads current state, computes the diff, and handles the edge cases, so that everyone downstream can just declare an end state. When nobody has done that work for your platform, you are back to imperative. That same module is often where the translation into platform syntax happens too, which is the Translate in the Executor pattern from Chapter 4: it needs the device’s current state to compute the delta, so it runs next to the device.
| Approach | Strengths | Tradeoffs |
|---|---|---|
| Declarative | Idempotent by nature; intent is easier to read; fewer operator mistakes because the tool handles edge cases | Depends heavily on module/provider quality; less control over execution path; troubleshooting can be harder when internals are abstracted |
| Imperative | Full control over each step; execution flow is explicit; works in almost any environment with CLI access | More code and testing effort; idempotency is on you; long-term maintenance grows quickly as edge cases accumulate |
A good way to see the difference is to look at Ansible, which supports both:
With Imperative Ansible, you’re literally telling Ansible which commands to run. If the VLAN exists, this still runs (though it might be idempotent depending on the module).
- name: Create VLAN 412
  cisco.ios.ios_command:
    commands:
      - vlan 412
- name app-paymentsWith Declarative Ansible you describe desired state. Ansible figures out what commands to run. If VLAN 412 already exists with correct name, Ansible does nothing.
- name: Ensure VLAN 412 exists
  cisco.ios.ios_vlans:
    config:
      - vlan_id: 412
        name: app-payments
state: mergedMost teams use declarative when possible, imperative when necessary. In short, prefer declarative when it fits. Just remember: declarative means someone else carries the burden, even if it looks simple from the outside.
Still in the engine logic, another important functionality is how the tasks are executed.
Serial versus Parallel#
Simplifying, two options exist for running tasks, and Figure 6.2 contrasts them:
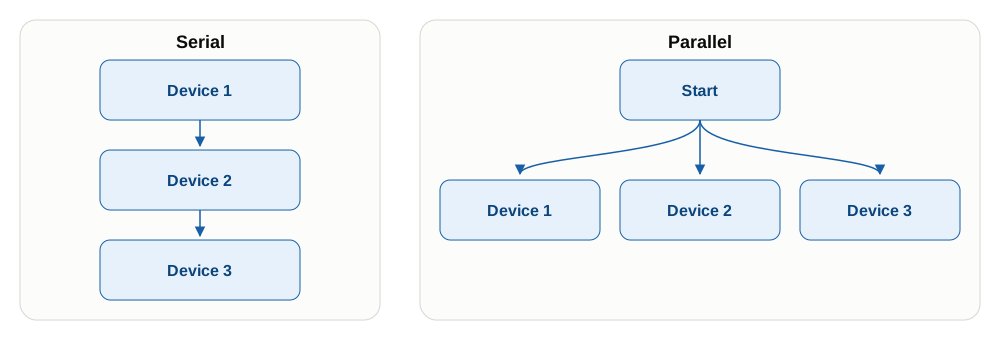
Serial execution: Process devices one at a time. Configure device 1, wait for completion, configure device 2, etc. Safe (you see failures immediately and can stop), but slow (100 devices = 100× the time of one device).
Parallel execution: Process multiple devices simultaneously. Configure devices 1-10 at once, 11-20 next, etc.
Why Nornir exists. Ansible has always run a task across hosts in parallel, up to the
forkslimit (five by default, which is the first thing to raise). What it adds, with the defaultlinearstrategy, is a barrier at every task boundary: no host starts step 2 until the slowest host finishes step 1. Across 800 switches, one unresponsive device sets the pace of every step in the play. Thefreestrategy lifts that barrier and lets each host run ahead. Nornir starts from the other end: it is a Python framework with a thread pool, so each device runs its whole workflow independently and you set the concurrency in code. The gain is not a fixed multiplier, it is that per-device latency stops compounding step by step.
However, parallel execution comes with some challenges that need to be considered:
- Control plane impact: Hitting 1000 devices simultaneously can overload management networks, data sources and authentication systems, or device control planes.
- Dependency handling: If devices depend on each other (spine before leaf), you need ordering. Pure parallelism doesn’t work.
- Error blast radius: If your automation has a bug, parallel execution deploys it to many devices before you notice. Serial execution fails on device 1, you stop before damaging devices 2-100.
My recommendation: use parallel execution with batching. Process devices in groups of 10-50, or waves, and verify the success of each batch before continuing. This balances speed with safety. Batch size is the easy half, though: which devices share a wave is what bounds the damage. Keep both halves of a redundant pair in different waves, and treat tiers that depend on each other as consecutive waves rather than parallel batches: spines first, verified, then leaves. Chapter 8 names this progressive wave rollout and covers the health gate between waves; Chapter 11 covers the deployment mechanics.
One constraint decides the batch size before any of this does: the change window. Sixteen batches of 50, each with a convergence wait and a verification pass, is a different proposition in a four-hour Saturday window than in a platform that deploys on demand. Do the arithmetic before picking the number, because the alternative is discovering at 05:00 that the window closed with 300 switches changed and 500 not. If the full scope does not fit, the scope is wrong rather than the batch size: split it across windows at a boundary you choose, with each window ending on a consistent state. Chapter 8 covers running under change control and Chapter 11 covers window scheduling.
Concurrency is one half of how the work gets distributed. The other half is where it runs from.
Agents and Workers#
Two topology questions decide how execution reaches the network: who initiates the connection, and where the execution runs.
Agentless execution is the default in networking, for a simple reason: you cannot install software on most network devices. The Executor connects in, does the work, disconnects, and nothing persists on the target. The cost is that every operation pays connection setup, and the Executor needs reachability and credentials for every device it manages.
Agent-based execution inverts the direction. Something on or near the device holds a persistent connection outward and pulls work from the central system. On servers this is standard; in networking it shows up as on-box agents on platforms that allow containers, and more often as a proxy worker: a small executor in a remote site that takes jobs centrally and runs them locally. The win is reachability, because the agent dials out and no inbound path to each device is needed, which matters for sites behind NAT or a strict firewall policy. The cost is one more component to deploy, monitor, and upgrade, and an agent that dies takes its devices offline from the automation’s point of view even though the network is healthy.
Worker placement follows from that choice. One central worker pool is simplest, and it holds until latency or reachability breaks it. Regional workers sit close to their devices, which matters most for CLI sessions, where a single task is dozens of round trips and every millisecond of latency multiplies. The tradeoff is distributed state: many workers, one place to record what happened. That is the distributed scenario State Management warned about, and the scaling side of it belongs to Chapter 12.
Dry-run support is another of the trust-building design principles from Chapter 2, like idempotency.
Dry-run#
Dry-run is the execution engine’s “plan” phase: simulate changes without touching devices, then surface a concrete diff and risks. A good dry-run pulls current state, computes the exact device-level operations that would run, and validates prerequisites (reachability, schema, dependency ordering). It should be fast, deterministic, and reproducible so reviewers can trust it.
Without analyzing the concrete syntax, the following example, a Terraform plan for an AWS VPC, shows what reviewable changes look like:
Terraform will perform the following actions:

  # aws_vpc.main will be created
  + resource "aws_vpc" "main" {
      + cidr_block           = "10.10.0.0/16"
      + enable_dns_support   = true
      + enable_dns_hostnames = true
      + tags = {
          + "Name" = "core-vpc"
        }
    }

Plan: 1 to add, 0 to change, 0 to destroy.This is what reviewers sign off on: the exact resources and attributes that would change, without touching the actual infrastructure.
In practice, dry-run is what makes approvals meaningful and rollbacks less likely. It gives humans a clear view of what will happen, and it gives the engine a chance to reject unsafe or inconsistent changes early. If the network platform supports candidate configs or commit-check, the engine should use those. Otherwise, dry-run is a computed diff plus pre-checks, not a guarantee (but better than nothing).
In my experience, offering dry-run capabilities is very convenient in the early days of an automation project to get network engineers’ buy-in. Later, the relevance decreases as your team gains confidence in the automation.
Dry-run covers the half of a change that has not happened yet. The other half needs checking afterwards.
Verification#
Dry-run asks what will happen; verification asks what did. The two are not symmetric. A clean dry-run is a prediction, a clean verification is evidence, and a change is not finished until you have the second one. Three things are worth checking, in increasing order of what they prove and what they cost:
- Config state: read the configuration back and confirm it matches the intent. Cheap and immediate, but it only proves the device accepted the text. A VLAN can be present in the config and carry no traffic.
- Operational state: check the device’s own view of the result. The VLAN is active, the interface is up, the Border Gateway Protocol (BGP) session is established. This proves the device acted on the configuration.
- Service state: check the thing the change was for. A host in the new VLAN gets an address and reaches its gateway. This is the only check that proves the change did what was asked.
All three checks read from the Collector and Observability functions, the blocks that gather device state and make it queryable (Chapter 7), consulted either by the Executor or by Orchestration depending on how close to the execution the check happens.
Timing matters as much as the choice of check. Protocols need time to converge, so verification that runs immediately after the apply reports failures that are not failures: a session mid-establishment, an interface still settling. Wait for convergence with a bounded timeout rather than checking once and trusting the answer.
All of this needs a “before” to compare against, which is what the before/after snapshot pattern from the Data Integration section is for. Without the first snapshot you cannot distinguish a problem you caused from one that was already there.
The last big responsibility of the Executor engine is to handle the challenges that could impact operational resilience.
Resiliency#
Everything fails, all the time.
Werner Vogels
Network execution is inherently unreliable (as most distributed systems are): devices reboot, connectivity hiccups, and control planes get overwhelmed. Other dependencies, such as the Intent block, may also have temporary issues. Resilient execution handles these gracefully via several strategies that will be extended in Chapter 12.
Retry logic handles transient failures. A connection timeout or a temporary CPU spike should trigger a retry with exponential backoff. An authentication failure or a syntax error should not: it will fail the same way every time. Cap the attempts, or a device that is down for good will hold your job open forever.
Rate limiting protects the systems you depend on, not the ones you are changing. A job that opens 150 device sessions at once also makes 150 authentication requests, 150 inventory lookups, and 150 secret reads. The devices are fine; the RADIUS server is not. Cap concurrency against each shared dependency separately, because their limits differ by an order of magnitude: an AAA server may handle a few dozen simultaneous logins, a Source of Truth API a few hundred requests per second, a secrets manager less than either. Retries multiply this load at exactly the wrong moment, when the dependency is already struggling, which is why backoff should be exponential and jittered: randomised, so the retries do not resynchronise into a second wave.
Timeouts come in three layers. A connection timeout bounds how long you wait for a device to answer. A task timeout bounds a complete operation, so one stuck device cannot hang the run. A global timeout bounds the entire job. Without all three, a single unresponsive switch can block a deployment to 800.
Error handling is the policy decision: what happens to the other devices when one fails? Fail fast aborts everything, which is safe but wastes the work already done. Keep going logs the failure and continues, which is efficient but can spread a bad change across the fleet. Threshold-based stops when failures cross a limit, and it is usually the right shape, but the limit belongs to the change rather than to the tool, so it is written in the workflow definition and passed to the job: Chapter 8 works through how to choose it, and why a forwarding or security change should be all or nothing where a monitoring change can run at 95%. Whatever you pick, apply it consistently: unpredictable partial-failure behavior destroys trust faster than an outright failure.
Rollback needs a snapshot taken before the change, not after you notice the problem. Capture the current config per device, and on failure restore it automatically for the affected scope only. This is execution rollback: one task undoing its own changes. Undoing tasks that already completed, because a later step of the workflow failed, is workflow compensation, and Chapter 8 covers it with the Saga Pattern. Rollback and dry-run are the same capability seen from two sides: one shows you the change before it lands, the other undoes it after.
Circuit breakers stop you from burning the job on dead devices. When a device fails repeatedly, mark it unhealthy and skip it for a while. Otherwise every batch pays the full connection timeout for a switch that has been powered off since last Tuesday.
Checkpointing saves progress as the job runs. If the engine crashes at device 600 of 800, you resume from the checkpoint instead of starting over. This is exactly what the team in the opening story did not have.
A good engine lets you stop short. Every change has four stages, and only the last one touches the device: get the intent from the SoT, as a rendered artifact or as technical-layer data a module will translate, gather the current configuration from the device, compare the two, then apply the difference (or replace if possible). Being able to run the first three on their own is what makes a change reviewable, and it is the same machinery dry-run uses.
The apply stage has its own gradient, ordered by blast radius. Merging adds your configuration to what is already there. Replacing swaps out one section and leaves the rest alone. Overwriting makes the whole device match the intent, which also deletes anything the intent does not mention. Declarative tooling exposes these as named states, and the names differ by tool while the blast radius does not. Pick the narrowest one that achieves the change, and be certain which one your module uses by default.
Building all this is hard. Most teams start with basic retry logic and add complexity as they hit failures in production.
And the final responsibility of the Executor is to provide a reusable write interface toward the network infrastructure.
Network Adapter#
Network devices speak different protocols. The network adapter layer abstracts these differences so upper layers don’t care whether they’re talking to a Cisco switch via SSH or an Arista switch via Representational State Transfer (REST) API.
This is the Executor’s half of the Adapter Pattern, which Chapter 10 develops in full: one adapter per device interface, all accepting the same input. The other half, translating intent into each platform’s syntax, is the component layer’s job (Chapter 4), whichever block hosts its code.
Beyond the traditional CLI over SSH (or Telnet), the industry has built interfaces that return structured data instead of screen output. These are the most widely used today:
| Interface | Description | Example Libraries/Tools | Typical Use |
|---|---|---|---|
| SSH / CLI | Most universal, least structured (text in/text out) | Netmiko (Python), Paramiko (Python), scrapli (Python), scrapligo (Go) | Legacy platforms, vendor-specific operational commands |
| NETCONF / RESTCONF | Structured model-driven management (YANG-based) | ncclient (Python), scrapli-netconf (Python), nemith/netconf (Go) | Declarative configuration and standardized data models |
| gRPC Network Management Interface (gNMI) / gNOI | gRPC-based interfaces for config/state and operational RPCs | pygnmi (Python), gnmic (Go CLI), openconfig/gnmi (Go) | Streaming telemetry and modern operations workflows |
| REST APIs | HTTP/JSON or XML APIs, often platform-specific | requests/httpx (Python), net/http + OpenAPI-generated clients (Go) | Controllers and cloud/network platform APIs |
| JSON-RPC / vendor gRPC | Structured RPC patterns used by specific network operating systems | Arista eAPI (JSON-RPC), vendor gRPC SDKs | Fast remote procedure execution with structured payloads |
All the libraries above are open source, though some also come with commercial support from the companies behind them.
Some of these interfaces still expose vendor-specific data models. But to keep code reusable, other libraries provide an abstraction layer with a common interface across platforms, such as:
- NAPALM (Network Automation and Programmability Abstraction Layer with Multivendor support): Python library that provides a unified API across vendors.
- Supports Cisco, Arista, Juniper, and others
- Under the hood, uses appropriate protocol (SSH, API, NETCONF)
- Use case: Multi-vendor environments where you want consistent automation code
- Cisco NSO (Network Services Orchestrator): a commercial product rather than a library. Its Network Element Drivers (NEDs) put every device, whatever its interface, behind one YANG-modeled API.
- Computes the diff against the device itself, and commits changes across many devices as one transaction, with rollback
- Service packages can translate a vendor-agnostic service model into per-device configuration, which makes NSO Translate in the Executor at product scale (Chapter 10)
- Use case: Multi-vendor service provisioning where the team accepts a commercial product’s model in exchange for transactions and ready-made drivers
- Pybatfish: Not a device transport library, but a strong companion for execution safety. A practical pattern is “plan/apply with NAPALM or Ansible, validate network behavior with pybatfish before and after changes”.
Why use an abstraction layer? Instead of writing different code for Cisco vs. Juniper, NAPALM gives you one API. Call get_facts() and NAPALM figures out how to get device facts whether it’s a Cisco IOS device (via SSH), Arista EOS (via eAPI), or Juniper Junos (via NETCONF).
The tradeoff: abstraction hides vendor-specific features. For common operations (get config, push config, get facts), it’s great. For more advanced operations or exotic vendor features, you drop back to native interfaces, because the abstraction likely does not implement them.
A library like NAPALM hides the interface. A declarative resource module goes one step further and hides the syntax too: it takes technical-layer data and produces the platform’s configuration itself. That is the Translate in the Executor pattern from Chapter 4. The module lives in the Executor’s codebase, but the translation it hosts is the Intent block’s responsibility. Three habits keep that boundary honest: send the module vendor-agnostic data and never pre-baked syntax, pin its version the way you would version a template, and require its dry-run diff before it applies anything.
Protocol translation is the visible half of the adapter. The other half is the connection lifecycle, and that is where scale problems show up. A CLI session over SSH is expensive: TCP handshake, key exchange, authentication, then a shell that has to be driven and parsed. Paying that cost once per task, across hundreds of devices, is how an executor overwhelms the systems around it. So the adapter manages connections rather than remaking them:
- Connection reuse: open one session per device and run every task in the job through it, instead of reconnecting per task.
- Pooling and caps: limit simultaneous sessions, both per device and in total, so a parallel job cannot open 800 at once. The cap protects the device control plane and the authentication system behind it.
- Session state: a CLI session has modes (enable, config, commit). The adapter tracks which one it is in, so a task never sends a config line to a prompt that cannot accept it.
- Teardown: close sessions deliberately. Devices cap concurrent management sessions, often at single digits, and an executor that leaks them locks out the engineers who need to log in.
Structured interfaces change the economics, not the principle. NETCONF and gNMI keep a long-lived channel open by design; a REST API is stateless per request but still wants a pooled HTTP connection and a cached token rather than a fresh login per call.
Moreover, network execution isn’t just configuration management. You may need to run other types of operations:
| Operation Type | What It Covers | Notes |
|---|---|---|
| Configuration changes | Push full configs/snippets/declarative state; merge/replace/delete modes | Most common operation type and best supported by tooling |
| Zero-Touch Provisioning (Zero Touch Provisioning (ZTP)) | Automated onboarding at first boot | A distinct execution pattern, detailed later in this chapter |
| File transfers | Upload images, download logs/backups | Common protocols: SCP, SFTP, TFTP, HTTP |
| Device operations | Reboot/reload, operational commands (ping/traceroute), backups | Common for day-2 operations and remediation |
| Rollback | Revert configuration to previous known-good state | Native rollback on some platforms; backup restore on others |
Each operation type has its own error modes and needs specific handling. Software upgrades need pre-checks (enough disk space?), post-checks (did the device boot correctly?), and rollback plans (if upgrade fails, reload old image). The results should be exposed to Orchestration for decisions, while Execution can still handle local guardrails and retries.
Where rendering and validation belong: The Intent block owns intent and its translation into platform syntax, the component layer, whether that runs as templates in the Source of Truth or as modules inside the Executor. Execution owns device-level safety checks and operational validation (reachability, pre/post checks) when it’s necessary to do just before execution. Orchestration decides when to validate and what to do with outcomes (approve, pause, rollback, or escalate). If you want a simple rule: validation that changes workflow belongs to Orchestration; validation that changes device actions belongs to Execution.
The Execution block is one of the most popular blocks of any network automation strategy because it’s the one that makes things happen. Almost every network automation product you can think of, even those focused on observability, has some execution capabilities.
Practical Considerations#
Three realities complicate the picture above: devices with no configuration yet, targets that are not devices, and the write access that makes this block the most consequential one to secure.
Zero Touch Provisioning#
Zero Touch Provisioning (ZTP) is a distinct execution pattern where a device boots for the first time and automatically retrieves and applies its full configuration without any human intervention at the device. The data flow is structurally different from day-2 operations and is worth treating as a named architectural pattern.
The ZTP flow
The flow runs in five steps, shown in Figure 6.3.
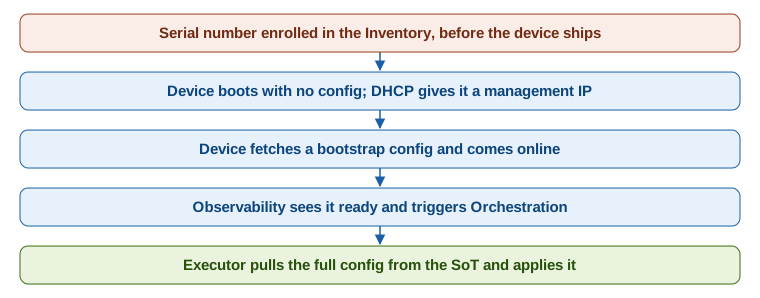
Before the device ships, it is enrolled in the Source of Truth, usually by serial number, which at that point is the only thing known about it. It boots with no configuration, and DHCP hands it a management address plus a pointer to a bootstrap server. It fetches a minimal bootstrap configuration from that server and comes online on the management network. Observability notices a device that is reachable and in the expected state, and signals Orchestration. The Executor then pulls the full intent from the Source of Truth and applies it.
The key insight is that the bootstrapping step is deliberately minimal: just enough configuration to get the device onto the management network and able to authenticate. Full provisioning runs after that as a standard Executor job, pulling complete intent from the Source of Truth. This means ZTP reuses the same execution pipeline as day-2 operations rather than requiring a separate provisioning system.
Common ZTP patterns
| Pattern | How it works | Trade-off |
|---|---|---|
| DHCP + static file | DHCP points to a static config file per device (matched by MAC or serial) | Simple to implement; does not pull from SoT; breaks at scale |
| DHCP + dynamic generation | Bootstrap server queries SoT and generates device-specific initial config at request time | SoT-driven from day zero; requires the SoT to have the device enrolled before it boots |
| OS image + config | Device downloads both OS image and config during boot (needed for devices requiring an OS provision) | Handles bare-metal or factory-reset devices; increases bootstrap server complexity |
ZTP introduces a sequencing dependency: the device must be enrolled in the Source of Truth before it physically boots, otherwise the bootstrap server has no data to confirm the device is expected and nothing to generate a config from.
An important consideration for the Executor is working well with two very different types of network infrastructure: physical and cloud-based.
Hybrid Execution#
The Executor increasingly needs to operate across two fundamentally different environments simultaneously: traditional network devices and cloud-native platforms. These environments have different API paradigms, authentication models, and failure modes. Treating them identically leads to fragile automation; treating them as completely separate systems duplicates effort and creates inconsistent operations.
The divergence problem
| Dimension | Network devices | Cloud platforms |
|---|---|---|
| API style | SSH, NETCONF, gNMI (stateful, long-lived connections) | REST/HTTP (stateless, short-lived requests) |
| Auth model | Shared credentials (username/password, SSH keys) | Temporary tokens, service accounts, instance roles (AWS SigV4, Azure AD, GCP service accounts) |
| Operation completion | Usually synchronous (the command either succeeds or fails before the session ends) | Often asynchronous (API returns “accepted”, requires polling for final status) |
| Failure ambiguity | A dropped NETCONF session is a clear failure | A cloud API timeout may or may not have applied the change; you must query to find out |
| Idempotency approach | Imperative by default; declarative requires careful module design | Natively declarative in most platforms (Terraform, CloudFormation, Pulumi) |
My recommendation is to keep Intent and Orchestration unified. The same business request that creates a VLAN on campus switches may also need to create a security group in AWS. The Source of Truth holds both. The Orchestrator coordinates both. Only at the Network Adapter layer does the execution path diverge: one adapter handles NETCONF/Ansible against campus switches; another handles Terraform or cloud provider APIs against the cloud environment.
This means the blast radius of a cloud API change and a network device change are governed by the same approval and audit trail, which is the correct architectural outcome even though the protocols are completely different.
The secrets manager strategy must accommodate both long-lived network device credentials and short-lived cloud tokens. This is one of the security considerations the Executor has to account for, because it’s the block of the architecture that changes the real network.
Security Considerations#
The Executor is the component in your architecture that has write access to the network. It can push configurations, restart services, upgrade firmware, and alter routing policies across hundreds of devices simultaneously. That makes its security posture more consequential than almost any other component, and yet it is frequently the most neglected from an architectural standpoint. A compromised or misconfigured Executor is not a data breach risk; it is a network outage risk.
Credential management
Credentials for network devices should never appear in playbooks, templates, job definitions, or version control. Store them in a dedicated secrets manager (HashiCorp Vault, AWS Secrets Manager, CyberArk) and inject them at runtime into the Executor’s environment, fetched at job start and discarded at the end. For cloud targets the same rule takes a stronger form: generate the credential at job start and never store it at all, using the provider’s own mechanism (AWS instance profiles, Azure managed identities, GCP workload identity).
The payoff is that rotation stops being an event. When device passwords are rotated, as they should be on a schedule, the Executor picks up the new value on its next run: no deployment, no reconfiguration, and no window where half the fleet still answers to the old password.
Least privilege per operation
Not every execution needs the same level of access. Read operations (gathering facts, dry-run checks, pre-deployment validation) should use read-only credentials. Write operations should use credentials scoped to the change type: a job deploying VLAN changes should not hold credentials that allow BGP configuration changes. Where the network platform supports role-based access (Arista roles, Cisco privilege levels, NETCONF access control), use it to limit the blast radius of any single compromised session.
Separation of concerns
Who can trigger execution and who can modify automation logic should be different roles with different access controls. An operator approving and launching a VLAN deployment job does not need, and should not have, access to modify the Ansible roles or playbook templates that implement it. For example, in AWX and AAP, this is enforced through role assignments: “Job Launcher” can start pre-approved job templates; “Project Editor” can change the underlying automation logic.
This separation matters most when automation is used for high-impact operations. The person initiating a firmware upgrade across 800 switches should not also be the person who wrote the upgrade playbook, or at minimum a second reviewer should have approved the playbook before it is available for production use.
Audit trail requirements
Every execution event must be logged with enough detail to reconstruct what happened: who triggered the job, which job template was used, which devices were targeted, what parameters were passed, what the outcome was for each device, and at what timestamp. Logs must be retained for the compliance period applicable to the organization, typically 12 to 24 months for change management in regulated industries.
This is not optional in most corporate environments. Change management processes require a traceable record linking a change ticket to a specific execution event to a specific set of device changes. Design this audit trail into the Executor from the start rather than retrofitting it later.
Network segmentation of the automation infrastructure
The Executor and its control plane (AWX, Ansible control nodes) should sit in a management network segment. Execution traffic to devices should flow through the out-of-band management network where available, not through the same data plane the Executor might be modifying. Inbound access to trigger jobs should require authentication and should not be reachable from untrusted networks.
A practical failure mode to avoid: an Executor that is reachable from the production user VLAN means that any compromised host in that VLAN could potentially trigger network changes. Management plane access belongs on a management plane network.
With the functionalities and the practical realities covered, one question remains before the example: which tools implement them.
Solutions Landscape#
The list of Execution solutions is very long. This is a high-level list of the most popular ones, even though some of them also implement other architecture functions:
| Tool | Execution model and strengths | Best fit | Main limitations |
|---|---|---|---|
| Ansible | DSL (YAML), agentless, large module ecosystem, strong for mixed server/network automation | Teams that want quick wins and broad platform support | At large scale, it needs tuning; complex logic can become hard to maintain in YAML |
| Terraform | Declarative IaC (HCL), strong diff/plan engine, stateful workflows, excellent cloud integration | Teams already standardizing on Terraform for infrastructure | Network provider maturity varies; state management adds operational overhead; weaker for day-2 ops |
| Salt | Python-based with agent or agentless options, event-driven architecture, strong scale characteristics | Existing Salt shops or event-heavy operations | Smaller network-automation community and steeper onboarding |
| Nornir | Python-first framework, threaded parallelism, highly flexible, easier debugging and fast | Python-capable teams with custom or performance-sensitive needs | Fewer ready-made components; more engineering ownership required |
| Custom Python/Go | Maximum control and design freedom for domain-specific logic | Edge cases, internal platforms, and highly specialized workflows | You own everything: standards, reliability patterns, testing, and lifecycle support |
| Cisco NSO | Model-driven: YANG service models, one Network Element Driver per platform, transactional multi-device commits with rollback | Multi-vendor service provisioning, common in service provider networks | Commercial licensing; the device models and service logic live inside the product, so leaving it means rebuilding them |
| Vendor controllers | Intent + policy controllers with vendor-native workflows (examples: Cisco Catalyst Center, Aruba Central, Juniper Mist) | Teams standardizing around one vendor ecosystem with strong controller APIs | Less portable patterns in multi-vendor environments |
Many teams use multiple tools depending on the use case and network infrastructure. Do not underestimate the benefits of adopting an existing tool versus building from scratch. Most of the features you need are likely already in place.
And, to close this chapter, let’s show an example.
Implementation Example#
We continue with the campus network from Chapter 4. The VLAN service definition (its ID, subnet, and target switch groups) is now stored in the Source of Truth, with the templates for two of the campus’s three platforms. This example focuses on how the Execution block picks up that intent and deploys it reliably across all 800 switches, through both translation paths from Chapter 4.
Scenario: A business team requests a new VLAN for a new application. The request arrives through a ticketing system with the details (service name, building, profile, approval) and lands in the Source of Truth as business-layer input and finally technical layer, exactly as Chapter 4 describes. Network operations deploys this VLAN across access and distribution switches from three different vendors, verifies connectivity, and reports success.
Requirements:
- Deploy VLAN configuration to multiple switches in parallel
- Accept both a rendered artifact and technical-layer data, depending on the platform
- Verify pre-conditions (VLAN doesn’t already exist, switches are reachable)
- Perform dry-run to show what would change
- Execute actual deployment with rollback capability if failures occur
- Verify at three levels: the configuration reads back as intended, the VLAN is active on the device, and a host in the new VLAN reaches its gateway
Blocks involved:
- Source of Truth: holds the inventory and the VLAN service definition
- Orchestration: coordinates the phases and owns the triggering surface (API, webhook, schedule) and the approval gate
- Observability: supplies the pre and post data the validation gates read
- Execution:
- Data Integration: a dynamic inventory source that queries the Source of Truth at job start, the rendered artifact or the technical-layer record for each device, and a secrets backend that injects credentials
- Triggering: a webhook from the Source of Truth change, plus manual and scheduled entry points
- Engine: five phases (precheck, dry-run, deploy, verify, rollback), executed in batches of 50, with a separate concurrency cap for the authentication system
- State Management: per-phase and per-device status, with a rollback point captured per device
- Network Adapter: one adapter per platform family. For Vendor A and Vendor B it delivers the artifact the Source of Truth rendered; for Vendor C a declarative module translates the technical-layer record first. Each one reads its device’s responses
- Workers: one worker per campus site, close to its devices; execution state stays central
This example names no automation products on purpose. Several platforms can play each role, and naming them would date the chapter faster than anything else. The device platforms stay generic for the same reason: what matters is that there are three of them, speaking three different configuration syntaxes.
The fleet uses both translation paths, chosen per platform with the question from Chapter 4: does the translation need the device’s current state?
- Vendor A and Vendor B: Render in the Source of Truth. Their interfaces accept a full replace of the VLAN section, so the translation needs nothing from the device. The templates from Chapter 4 render a complete artifact per switch, and the Executor delivers it.
- Vendor C: Translate in the Executor. Its trunks accept only the whole allowed-VLAN list. Tagging VLAN 412 on an uplink that already carries VLANs 10 and 20 means sending
10,20,412, and only something that has read the device knows the10,20part. A template in the Source of Truth cannot, so the Executor receives the technical-layer record and a declarative module produces the syntax.
Listing 6.4 shows what reaches the Executor on each path.
# vendor-a, vendor-b: Render in the Source of Truth
device: sw-b-acc-07
platform: vendor-a
input: rendered artifact
artifact: artifacts/REQ-4471/sw-b-acc-07.cfg   # produced by the SoT template
---
# vendor-c: Translate in the Executor
device: sw-d-acc-03
platform: vendor-c
input: technical-layer data
module: vendor-c-vlans 2.3.1        # pinned, versioned like a template
vlan: { id: 412, name: app-payments, tagged_on: [Po1, Po2] }The Vendor C record carries no syntax. Nothing in it would change if the campus replaced Vendor C tomorrow, and that is the boundary Chapter 4 asks for. From here on, the phases are the same for every switch. Only two of them behave differently by path: the dry-run, and what the adapter receives.
Implementation Flow#
The Executor job starts as soon as the Source of Truth reports a change and the Orchestrator decides it is time to make the network match the new intent. Figure 6.4 shows the four phases and who owns each step; the list below walks through them.
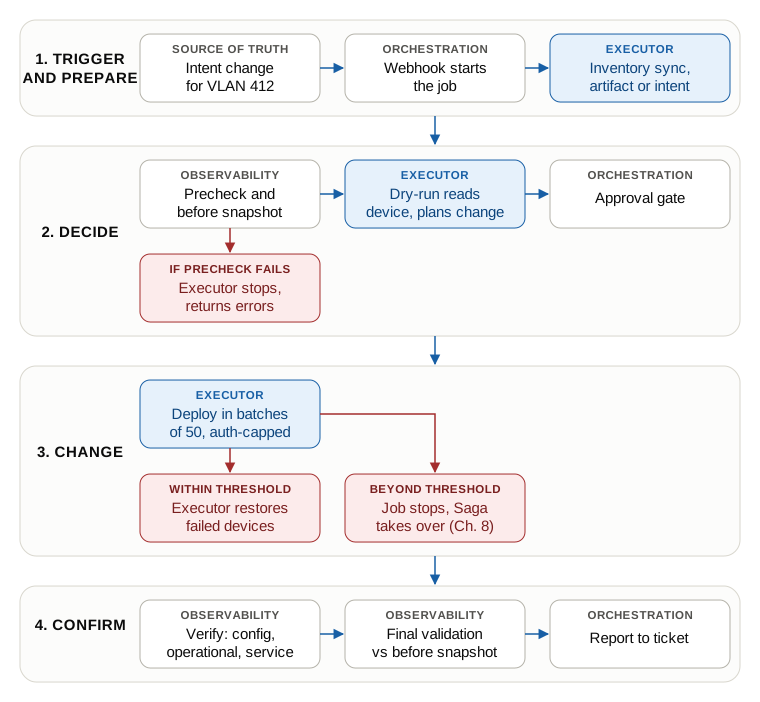
Trigger and prepare. An intent change in the Source of Truth fires a webhook and the workflow starts. It syncs inventory from the Source of Truth, so the target list reflects what is enrolled right now rather than what was enrolled when the job was written, and it fetches what each switch needs: the rendered artifact for Vendor A and Vendor B, the technical-layer record for Vendor C.
Decide. The precheck phase validates reachability, the existing VLAN state, and the site guardrails, and records the before snapshot that verification will compare against. The dry-run phase reads each device and computes what would change, without applying anything. For Vendor A and Vendor B it compares the rendered artifact with the running configuration; for Vendor C the module reads the trunk lists and reports the commands it would send. Both paths produce the same change plan, so the approver reviews one format. The approval gate, which belongs to Orchestration, then holds for a human who is deliberately not the person who wrote the automation. Nothing has touched a device yet, and that is the point: everything up to here is undone by walking away.
Change. The deploy phase applies the VLAN intent in batches of 50, capped separately against the authentication system. Where devices fail within the change’s threshold, the rollback phase restores those devices only. Beyond the threshold, the job stops and reports, and the Orchestrator’s Saga takes over, as Chapter 8 describes.
Confirm. The verify phase checks configuration, operational state, and the service itself, waiting for convergence before it believes the answer. Observability supplies the after data, final validation compares it against the before snapshot, and the execution summary goes back to the ticket.
Each handover between phases carries an artifact.
The Artifacts Between Phases#
Four artifacts carry the job. Their shape matters more than their syntax: whatever tool you use produces something equivalent, and if it does not, you have found a gap.
The dry-run phase produces one change plan per inventory item. This is what the approver signs off on, so it has to answer three questions: what is there now, what would change, and what is at risk if it goes wrong. Listing 6.5 shows the plan for one Vendor A switch. The source field records where the diff came from, which is the visibility rule from Chapter 4 in practice. A Vendor C plan has the same shape: source names the module’s dry-run instead, and current adds the trunk lists the module read before computing the change.
device: sw-b-acc-07
platform: vendor-a
source: rendered artifact vs running config
reachable: true
current:
  vlan_412: absent
planned:
  - create vlan 412, name app-payments
  - tag vlan 412 on uplinks Po1, Po2
risk:
  users_behind_this_switch: 46
  redundant_uplink: true
rollback_point: cfg-20261010-1431.bakSimilarly, the deploy phase produces one result record per device, or per inventory item. Note the two fields that make a retry safe: attempts tells you this device was tried twice, and rollback_point names the configuration it can be returned to. As noted earlier, for security reasons that rollback point may have to live in the secrets backend, or exclude the secrets that are resolved at run time.
Every artifact from the deploy phase onward carries the same two identifiers. The request_id is the change ticket that asked for this, and the job_id is this particular execution of it. A re-run after a partial failure keeps the same request_id and gets a new job_id, which is how you tell “we tried twice” from “two people asked for the same thing”. Without that pair the audit trail described in the Security Considerations section cannot be reconstructed: you end up with device changes that have no request behind them, and requests with no evidence of what they did.
{
  "request_id": "REQ-4471",
  "job_id": "JOB-20261010-1431",
  "device": "sw-b-acc-07",
  "phase": "deploy",
  "status": "changed",
  "started": "2026-10-10T14:31:08Z",
  "duration_s": 3.4,
  "attempts": 2,
  "first_error": "connection timeout",
  "rollback_point": "cfg-20261010-1431.bak"
}The verify phase produces its own record, and waited_s is the field that makes it trustworthy: the check did not run the instant the config landed, it waited for the protocols to settle.
{
  "request_id": "REQ-4471",
  "job_id": "JOB-20261010-1431",
  "device": "sw-b-acc-07",
  "phase": "verify",
  "status": "passed",
  "config": "match",
  "operational": "vlan 412 active, tagged on Po1 and Po2",
  "service": "test host in vlan 412 reached its gateway",
  "waited_s": 12
}The batch summary aggregates those records while the job is still running. This is the artifact the team in the opening story did not have: at any moment it says exactly which devices are done, which failed, and which have not been touched.
request_id: REQ-4471            # the change ticket
job_id: JOB-20261010-1431       # this execution of it
name: vlan-412-app-payments
batch_size: 50
auth_concurrency_cap: 20   # the AAA server, not the switches, sets this
batches_completed: 11 of 16
devices:
  ok: 540         # already compliant, no change made
  changed: 8
  failed: 2
  pending: 250
failed_devices:
  - sw-c-acc-12   # authentication failure, not retried
  - sw-a-acc-04   # unreachable after 3 attempts
halt_threshold: 5% per batch, not reachedThe split between ok and changed is idempotency made visible: 540 switches already had the VLAN and were left alone, 8 did not and were configured. Re-run the job and changed drops to zero.
Solution Summary#
This implementation demonstrates all key execution capabilities:
- Data Integration: pulls inventory and intent from the Source of Truth at job start, as a rendered artifact or as technical-layer data, and credentials from the secrets backend
- Triggering: webhook, API, and schedule entry points, plus approval-gated execution
- State Management: per-phase and per-device status tracks progress and failure domains; the rollback path is explicit
- Engine: parallel execution in batches, error handling, and dry-run
- Network Adapter: one adapter per platform family delivers three different configuration syntaxes over each platform’s interface, and interprets its responses and error codes. Two syntaxes arrive rendered from the Source of Truth; the third comes from a declarative module translating the technical layer
- Observability: pre and post data collection supports final validation and reporting
Resiliency features:
- Pre-checks prevent deploying to unreachable devices or creating duplicate VLANs
- Dry-run shows changes before applying, in the same change plan format on both translation paths
- Safety checkpoints fetch the intended artifact and gather the current config before any apply step runs
- Idempotent adapters make re-running safe
- Post-verification catches silent failures
- Rollback runs as a separate phase, limited to the failed devices; beyond the threshold, the Orchestrator’s Saga takes over
Scaling considerations:
- Parallel execution in batches of 50 switches, verified before the next batch starts
- At this size, batch sequencing belongs to the Orchestrator rather than the engine, which just runs one batch well
- The concurrency cap comes from the weakest shared dependency, here the AAA server, not from the device count
None of this needed an exotic tool. It needed the five functionalities wired together in the right order, with an artifact at every handover and a way back at every step.
Summary#
The 150 switches nobody could account for were not a playbook problem. The playbook was fine. What was missing was everything around it: state tracking to say which devices were done, batching to keep 150 simultaneous authentication requests off the RADIUS server, and a checkpoint to resume from. That is the Execution block. Not the command, but everything that makes the command safe to run 800 times.
It starts with data integration and triggering, then depends on state management (idempotency, rollback, and transaction-like safety), a capable engine (language, concurrency, topology, dry-run, verification, resiliency), and a network adapter layer that hides protocol differences and manages the connections underneath them. Observability feeds validation and guardrails, while Orchestration decides when to proceed or stop. The tooling matters less than the execution patterns: integrate data, trigger intentionally, execute deterministically, validate results, and keep a clean rollback path.
Start small and scale deliberately: one workflow, one device class, and clear pre/post checks. Add batching, rate limits, and stronger validation as the blast radius grows. Execution is powerful and risky; test thoroughly, roll out gradually, monitor constantly, and always plan for rollback.
Execution reports what it did. Chapter 7 covers how you learn what actually happened, which is not always the same thing.
References#
- Network Programmability and Automation, 2nd Edition, Matt Oswalt, Christian Adell, Scott S. Lowe, and Jason Edelman (O’Reilly, 2023). Automation tooling and architecture, including the config-generation-and-push mechanics at the heart of the execution layer (Chapters 11 and 13).
- Network Automation Cookbook, 2nd Edition, Christian Adell, Jeffrey Kala, and Karim Okasha (Packt, 2025). Recipe-driven, Ansible-based execution across multi-vendor and cloud networks; a hands-on companion to the execution patterns in this chapter.
- Mastering Python Networking, 4th Edition, Eric Chou (Packt, 2023). Python-based execution with NAPALM, Nornir, and Netmiko; the imperative-execution counterpart to declarative tooling.
- Infrastructure as Code, 2nd Edition, Kief Morris (O’Reilly, 2021). Declarative, idempotent execution and the reconciliation model behind treating config changes as versioned code.
💬 Found something to improve? Send feedback for this chapter